
Soyuhos, O., & Baldauf, D. (2023). Functional connectivity fingerprints of the frontal eye field and inferior frontal junction suggest spatial versus nonspatial processing in the prefrontal cortex. European Journal of Neuroscience, 57(7), 1114–1140. https://doi.org/10.1111/ejn.15936
rMEG-FEF-vs-IFJ/
├── Analysis_Pipeline/
│   ├── AnalysisPipeline_Part1.m        # Preprocessing entry point
│   ├── AnalysisPipeline_Part2.m        # Full connectivity analysis entry point
│   └── helper_fun/
│       ├── load_path.m                 # Directory configuration (edit before running)
│       ├── clean_data.m                # MEG artifact removal (ICA, bad channels/segments)
│       ├── scouts_timeSeries.m         # Source reconstruction via Brainstorm (dSPM2018)
│       ├── functional_connectivity.m   # Per-subject connectivity computation (oPEC/iCOH/dwPLI/PDC)
│       ├── results_connectivity.m      # Per-subject connectivity results, saves .mat and .xlsx
│       ├── group_average_topK_forSelectedROIs.m    # Group average for iCOH / dwPLI (seed-based)
│       └── group_average_topK_wholeConnectivity.m  # Group average for oPEC / PDC (whole-brain)
└── Visualize_Results/
    ├── fsaverage/                      # fsaverage surface templates (multiple smoothing levels)
    ├── results/                        # Group-level connectivity matrices (see Data Availability)
    └── scripts/
        ├── RUNME_visualizeResults_functionConn.m               # Functional connectivity visualization
        ├── RUNME_visualizeResults_functionConn_collapseTargets.m  # Lateralization-collapsed version
        ├── RUNME_visualizeResults_effectiveConn.m              # Effective (directional) connectivity
        ├── helper_saveFig_functionalConn.m                     # Batch figure saving (functional conn)
        ├── helper_saveFig_effectiveConn.m                      # Batch figure saving (effective conn)
        └── helper_fun/
            ├── load_path.m                              # Directory configuration (edit before running)
            ├── helper_functionConn_fsaverage.m          # fsaverage visualization for functional conn
            ├── helper_functionConn_fsaverage_freqCollapsed.m   # Frequency-collapsed version
            ├── helper_effectiveConn_fsaverage.m         # fsaverage visualization for effective conn
            ├── helper_functionConn_circularGraph.m      # Circular graph visualization
            ├── helper_save_figure.m                     # Figure saving utility
            ├── helper_violinplot.m                      # Violin plot visualization
            ├── tutorial_nwa_connectivityviewer.m        # 3D connectivity viewer (from FieldTrip)
            ├── cmap_rbw.m                               # Red-blue-white colormap (from Brainstorm)
            ├── fdr_bh.m                                 # FDR correction
            ├── circularGraph/                           # Circular graph toolbox (third-party)
            └── Violinplot-Matlab-master/                # Violin plot toolbox (third-party)
- MATLAB R2012b or later
- FieldTrip r10442
- megconnectome 3.0
- MATLAB R2020a or later
- FieldTrip 20210411
- Brainstorm (version 28-May-2021 or later)
- MATLAB R2020a or later
- FieldTrip 20210411
- Third-party MATLAB toolboxes (included in
helper_fun/):
Before running any script, fill in the directory paths in the load_path.m files:
- Analysis Pipeline:
Analysis_Pipeline/helper_fun/load_path.m - Visualization:
Visualize_Results/scripts/helper_fun/load_path.m
Each file contains clearly labeled variables for the locations of toolboxes, raw data, and output directories.
Cleans raw resting-state MEG recordings from the HCP dataset and segments them into epochs.
- Open
Analysis_Pipeline/AnalysisPipeline_Part1.m - Fill in
subjectidswith your subject IDs (e.g.,{'111514', '140117'}) - Set
trialDurationto2,5, or10(seconds) - Run the script
Output: cleaned, epoched data saved per subject under cleandata/.
End-to-end seed-based functional connectivity analysis at the group level.
- Open
Analysis_Pipeline/AnalysisPipeline_Part2.m - Fill in
subjectids - Select analysis options:
trialDuration:2,5, or10connMetric:'oPEC','iCOH','dwPLI', or'PDC'
- Run the script
The pipeline runs three steps automatically:
| Step | Function | Description |
|---|---|---|
| 2 | scouts_timeSeries |
Source reconstruction (Brainstorm + dSPM2018 inverse, Glasser atlas) |
| 3 | functional_connectivity |
Computes connectivity per subject per frequency band |
| 4 | results_connectivity / group_average |
Aggregates and saves group-level connectivity results |
Seed regions: L/R FEF, L/R IFJa, L/R IFJp (Glasser atlas)
Frequency bands: delta (1–4 Hz), theta (4–8 Hz), alpha (8–13 Hz), beta (13–30 Hz), gamma (30–100 Hz)
Ground-truth analysis — oPEC (orthogonalized Power Envelope Correlation):
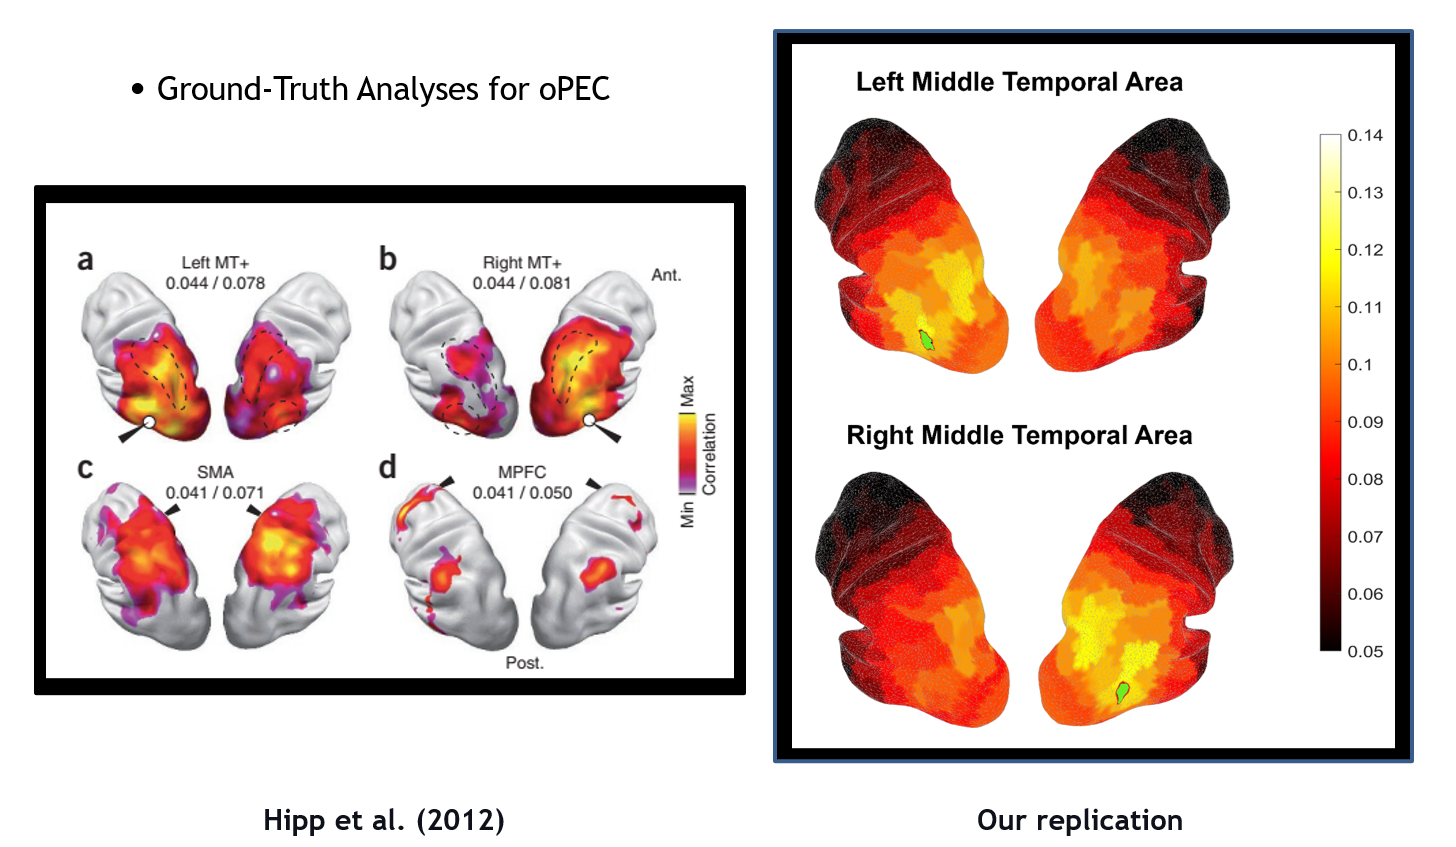
Applies statistical masking (Wilcoxon signed-rank test + FDR correction) and renders results on the fsaverage surface.
| Script | Description |
|---|---|
RUNME_visualizeResults_functionConn.m |
Functional connectivity per hemisphere (fsaverage + circular graph) |
RUNME_visualizeResults_functionConn_collapseTargets.m |
Same, collapsed across lateralization |
RUNME_visualizeResults_effectiveConn.m |
Directional connectivity (PDC); green = seed→target, magenta = target→seed |
Configurable options in each script: band_name, seed_target, conn_metric, statistics.alpha, FDR correction, and figure export.
The MEG data used in this study are publicly available through the Human Connectome Project (HCP 1200 Subjects Release).
This repository is licensed under the GNU General Public License v3.0. See LICENSE for details.
Portions of the code are adapted from:
- megconnectome 3.0 — Copyright (C) 2011–2014 Human Connectome Project, WU-Minn Consortium
- FieldTrip —
tutorial_nwa_connectivityviewer.m - Brainstorm —
cmap_rbw.m