


![]()
seaborn_objects_recipes is a Python package that extends the functionality of the Seaborn library, providing custom recipes for enhanced data visualization. This package includes below features to augment your Seaborn plots with additional capabilities.
Tip
For the full gallery and API, see the docs: API-Gallery Docs
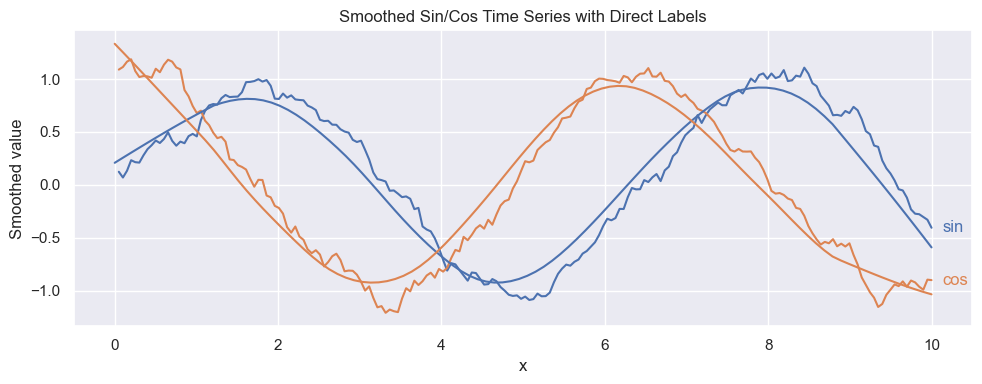
This example shows how multiple recipes can be layered to clarify noisy time-series data. We generate two synthetic series (sin and cos), apply a short-window rolling mean to smooth local fluctuations, overlay a LOWESS curve to reveal the long-term structure, and add LineLabel to place direct text labels at the right edge of each line.
This pattern is useful when you want:
- Local smoothing (Rolling) to reduce short-term noise
- Nonparametric smoothing (Lowess) to reveal global trends
- Direct labeling (LineLabel) to avoid legends and improve readability in multi-series plots
Together, these transforms produce a clean, interpretable visualization that emphasizes both local variation and overall structure — ideal for exploratory time-series analysis, sensor measurements, economic indicators, or any repeated noisy signal.
    import seaborn.objects as so
    import seaborn_objects_recipes as sor
    import seaborn as sns
    import numpy as np
    import pandas as pd

    # ---- Example data ----
    np.random.seed(42)
    x = np.linspace(0, 10, 200)
    y1 = np.sin(x) + np.random.normal(scale=0.25, size=len(x))
    y2 = np.cos(x) + np.random.normal(scale=0.25, size=len(x))

    df = pd.DataFrame(
        {
            "x": np.tile(x, 2),
            "y": np.concatenate([y1, y2]),
            "series": np.repeat(["sin", "cos"], len(x)),
        }
    )

    (
        so.Plot(df, x="x", y="y", color="series", text="series")
        # Rolling-smoothed line
        .add(so.Line(), rolling := sor.Rolling(window=8, agg="mean"),legend=False,)
        # LOWESS-smoothed line (overlaid)
        .add(so.Line(), sor.Lowess(frac=0.25),legend=False,)
        # Direct labels at the right edge of each series
        .add(sor.LineLabel(offset=8), rolling)
        .layout(size=(10, 4))
        .label(
            title="Smoothed Sin/Cos Time Series with Direct Labels",
            x="x",
            y="Smoothed value",
        )
        .show()
    )
To install seaborn_objects_recipes, run the following command:
pip install seaborn_objects_recipesFor questions or feedback regarding seaborn_objects_recipes, please contact Ofosu Osei.
- Special thanks to @nickeubank for the support and mentorship on this project
- Special thanks to @JesseFarebro for Rolling, LineLabel
- Special thanks to @tbpassin and @kcarnold for LOWESS Smoother
Contributions are welcome! Please feel free to submit a Pull Request.
Important
Quick Checklist:
- ✅ Distinct x-value count valid for LOWESS (frac ≥ 2/n)
- ✅ CI columns present (ymin, ymax) when bootstrapping is on
- ✅ alpha respected and bootstraps defaulted if unset