Imports COVID-19 data from the open data portals of various sources into InfluxDB. The script may be called via a cronjob to regularly import the data.
Currently supported sources:
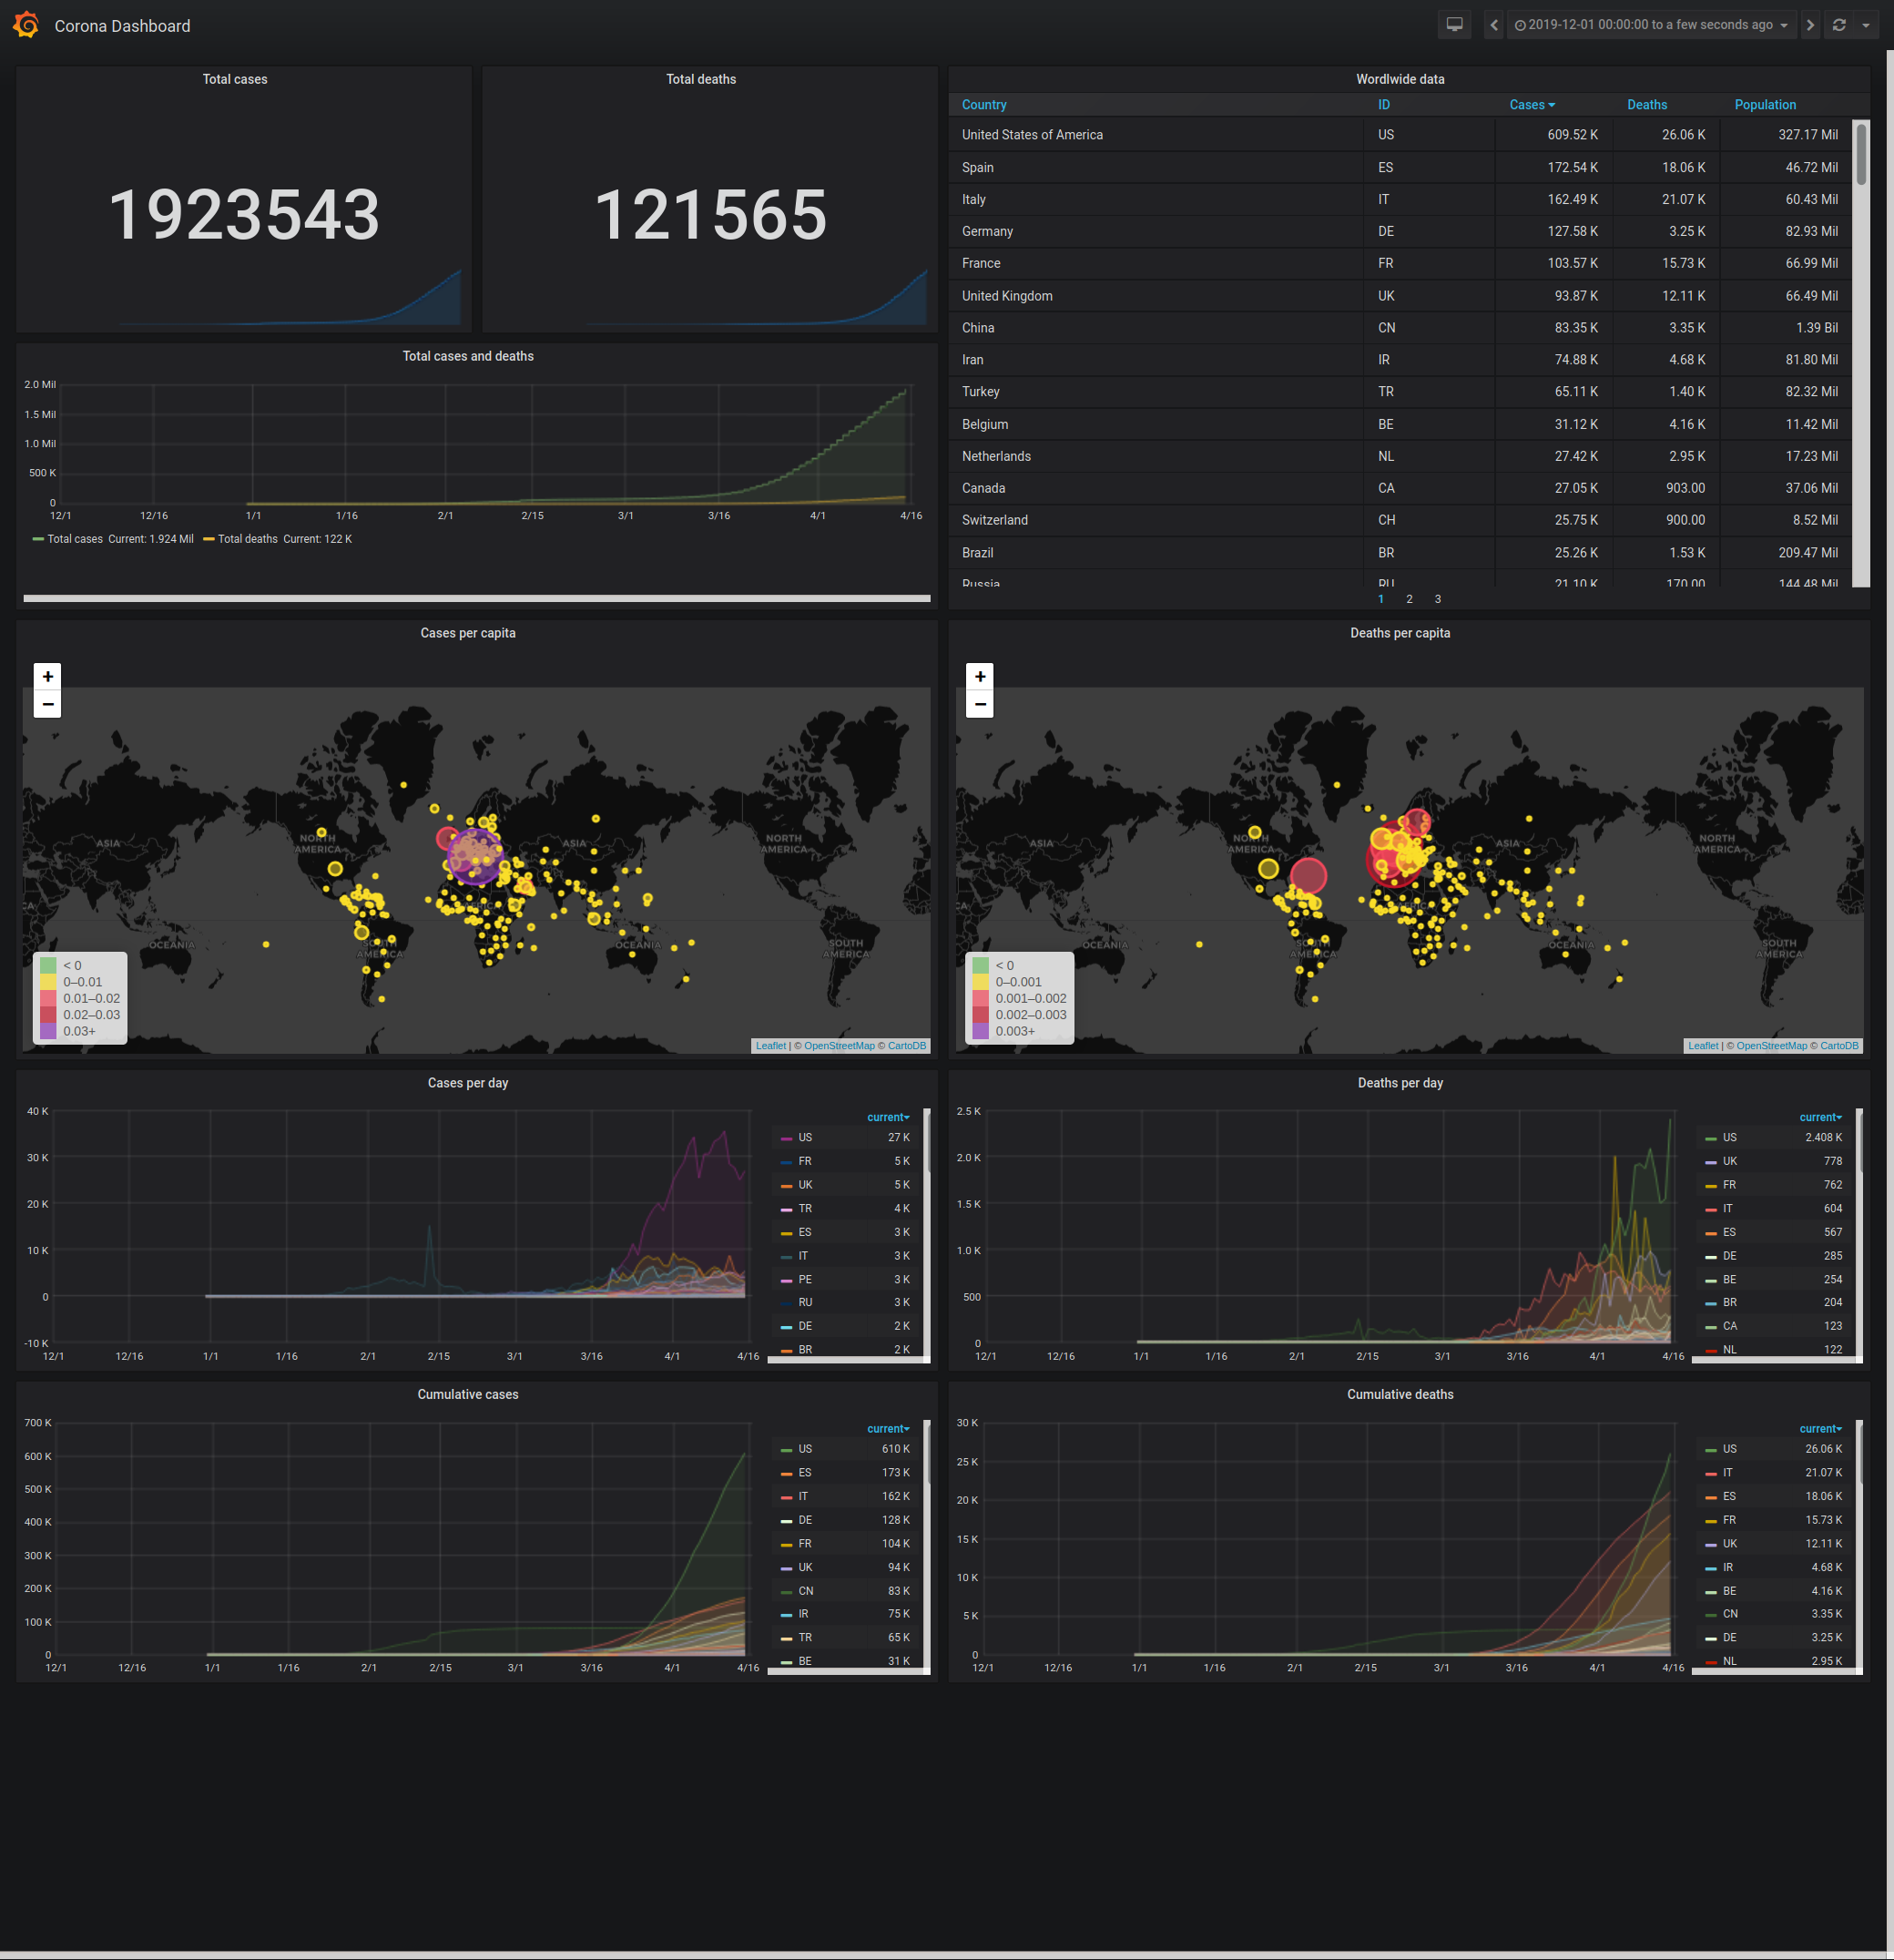
I used this to build a data dashboard in Grafana (example dashboard config JSON is part of this repo).
Crate a venv and install via pip:
python3 -m venv covid19-dashboard
pip install git+https://github.com/haemka/covid19-dashboard
Create a config file at conf/covinflux.conf within your venv. Example is
provided in conf/covinflux-example.conf.
The config file is separated into several sections. And almost self explanatory. For details look into the provided example.
| Section | Description |
|---|---|
modules |
Allows to enable or disable each module. |
module_* |
Contains the configuration for a specific module. |
influxdb |
Contains the configuration needed to connect to your InfluxDB instance. |
logging |
Contains logging related configuration. |
You may need to disable (or raise) max-values-per-tag in your influxdb.conf.
This is especially true for detailed data like the RKI datasets.
Currently supported modules are:
| Module | Data source | Source data link |
|---|---|---|
| ECDC | Data from the European Centre for Disease Prevention and Control | Link |
| RKI | Data from the Robert Koch Institute | Link |
Just run pycovinflux within your venv.
| Parameter | Description |
|---|---|
-c CONFIGPATH --config CONFIGPATH |
Allows you to specify a non standard path to your config file |
-l LOGFILEPATH --log LOGFILEPATH |
Allows you to specify a custom log file path (overrides configuration value) |
-v --verbose |
Increases verbosity of the shell output |
-d --debug |
Enables debug logging (overrides config value) |
-h --help |
Show help |
Example dashboards are part of this repo: