Tested with Python 3.9.23. To setup the environment run these two commands in a parent folder of the downloaded repository (replace / with \ and possibly add --user if on Windows:
Step 1: Clone the repository
git clone https://github.com/Shaadalam9/llm-traffic-sceneStep 2: Create a new virtual environment
python -m venv venvStep 3: Activate the virtual environment
source venv/bin/activateOn Windows use
venv\Scripts\activateStep 4: Install dependencies
pip install -r requirements.txtStep 5: Ensure you have the required datasets in the data/ directory, including the mapping.csv file.
Step 6: Run the code:
python3 run.pyConfiguration of the project needs to be defined in config. Please use the default.config file for the required structure of the file. If no custom config file is provided, default.config is used. The config file has the following parameters:
videos: Directory containing the videos generated from Veo3.mapping: CSV file containg the information about the cities.data: Directory containing the YOLO output.snaps: Directory containing the first frame from each generated video file.confidence: Sets the confidence threshold parameter for YOLO.model: Specifies the YOLO model to use; supported/tested versions includev8xandv11x.tracking_mode: Configures YOLO for object tracking.always_analyse: Always conduct analysis even when pickle files are present (good for testing).display_frame_tracking: Displays the frame tracking during analysis.save_annotated_img: Saves the annotated frames produced by YOLO.save_tracked_img: Saves the tracked frames produced by YOLO.delete_labels: Deletes label files from YOLO output.delete_frames: Deletes frames from YOLO output.delete_runs_files: Deletes files containing YOLO output after analysis.font_family: Specifies the font family to be used in outputs.font_size: Specifies the font size to be used in outputs.plotly_template: Defines the template for Plotly figures.logger_level: Level of console output. Can be: debug, info, warning, error.
 Distribution of different objects detected in the videos, sorted in alphabetical order..
 Distribution of objects detected in the videos, sorted by the average values of object counts..
 Distribution of objects detected in the videos, first grouped by continent and then sorted by average values within each continent.
 Sound from different countries (measured in dB).
 Distribution of object detected in 10 different videos of New York City (United States) and Kampala (Uganda).
 |
 |
 |
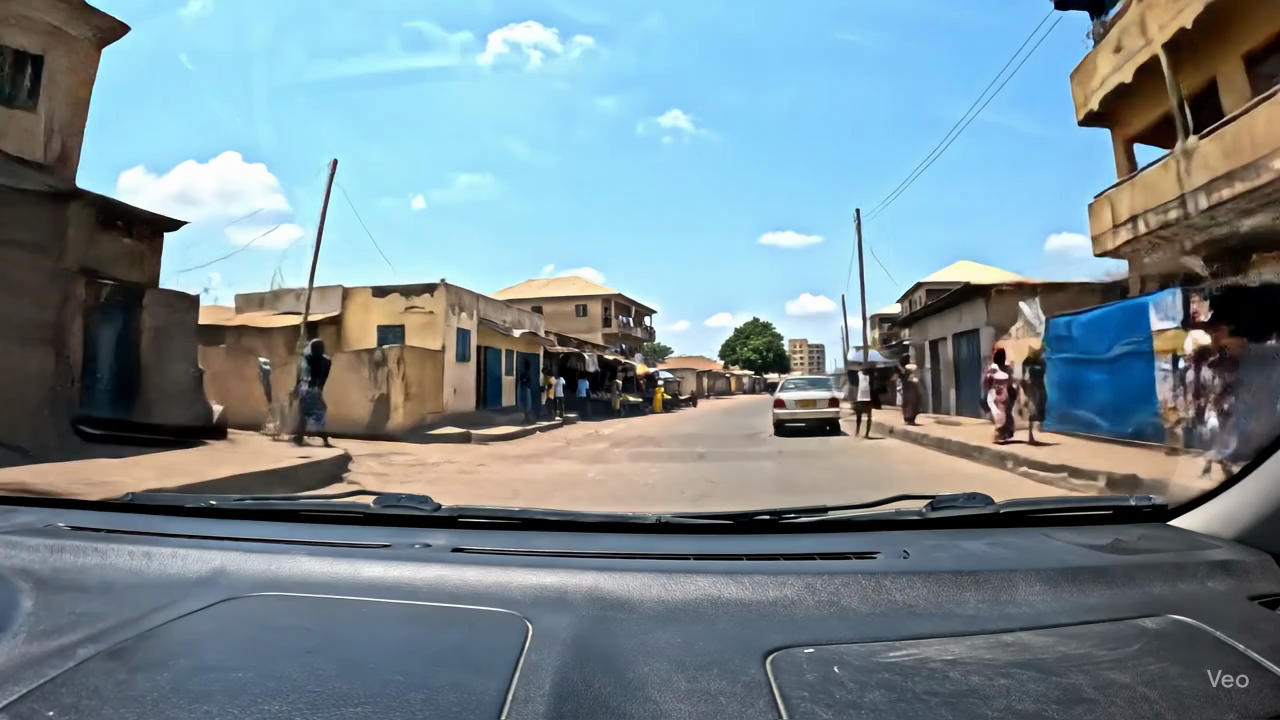 |
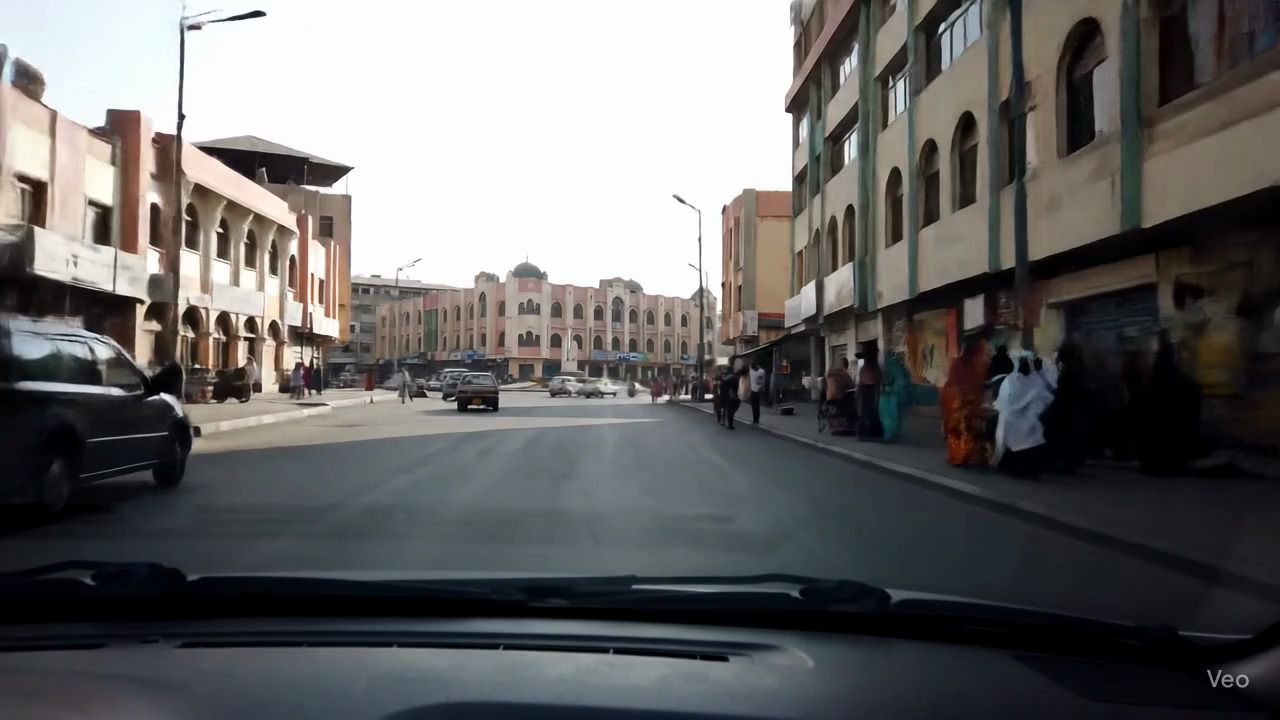
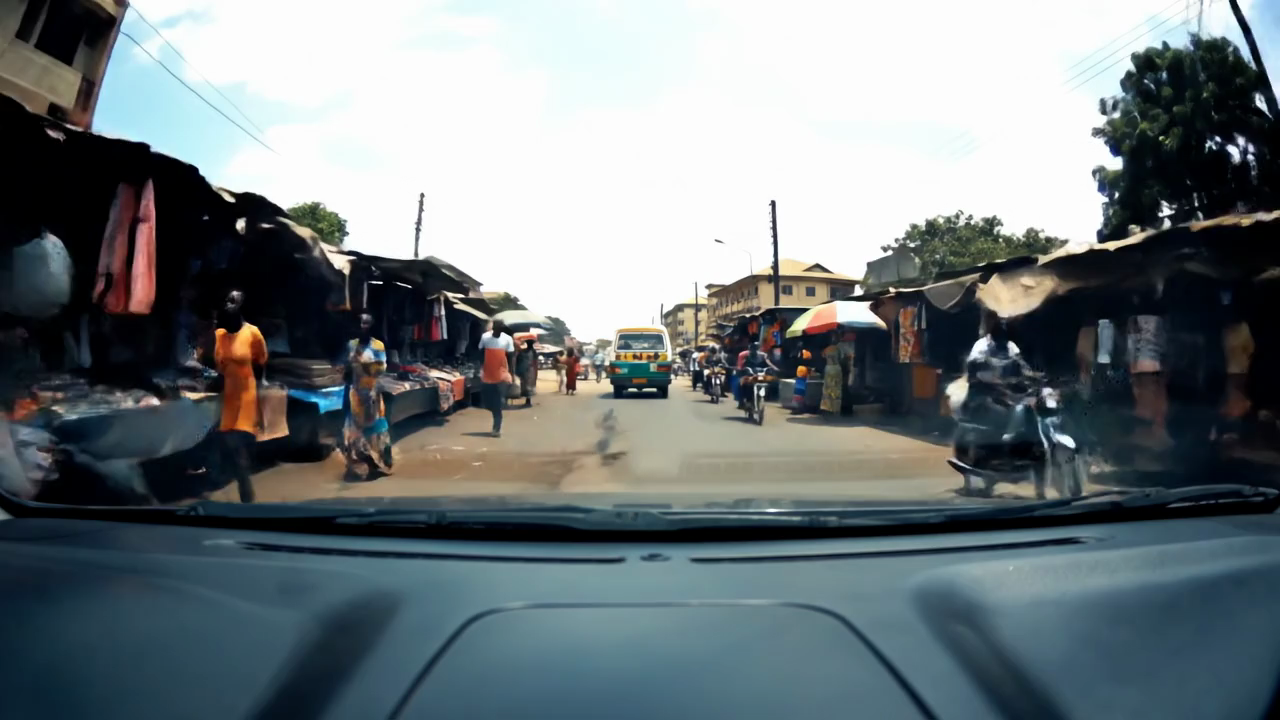
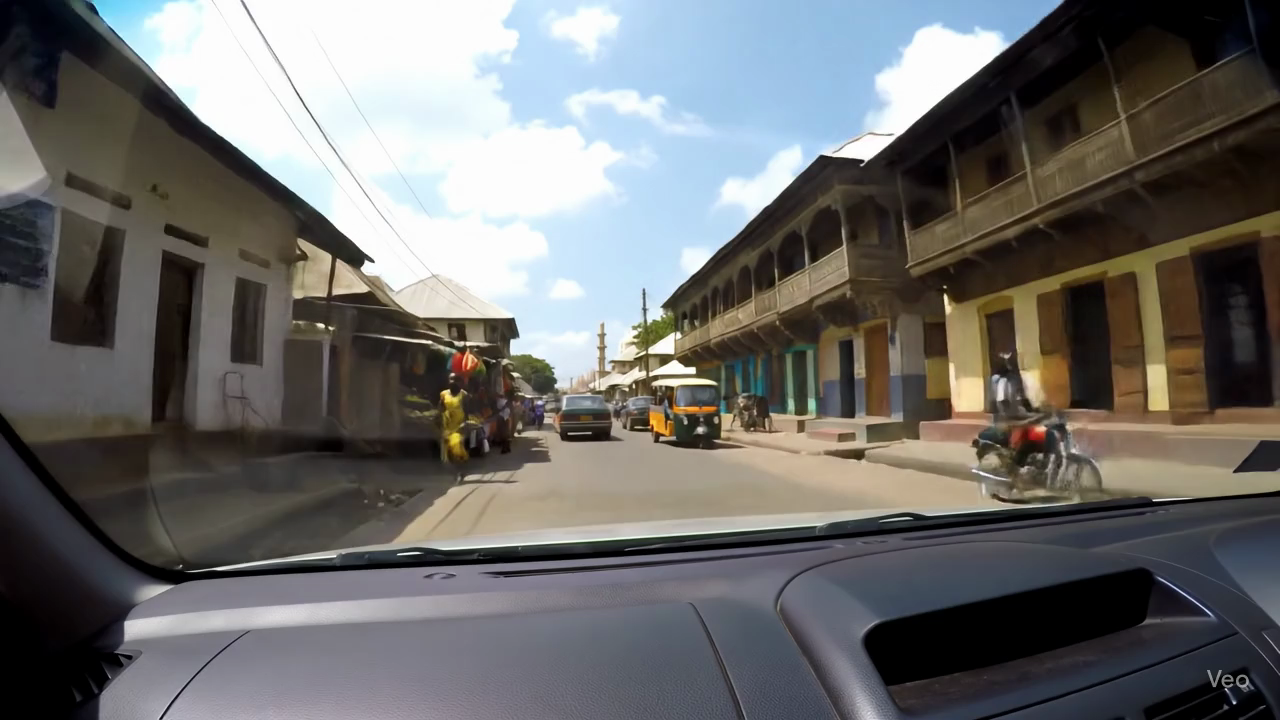
| Accra (Ghana) | Algiers (Algeria) | Asmara (Eritrea) | Banjul (Gambia) |
 |
 |
 |
 |
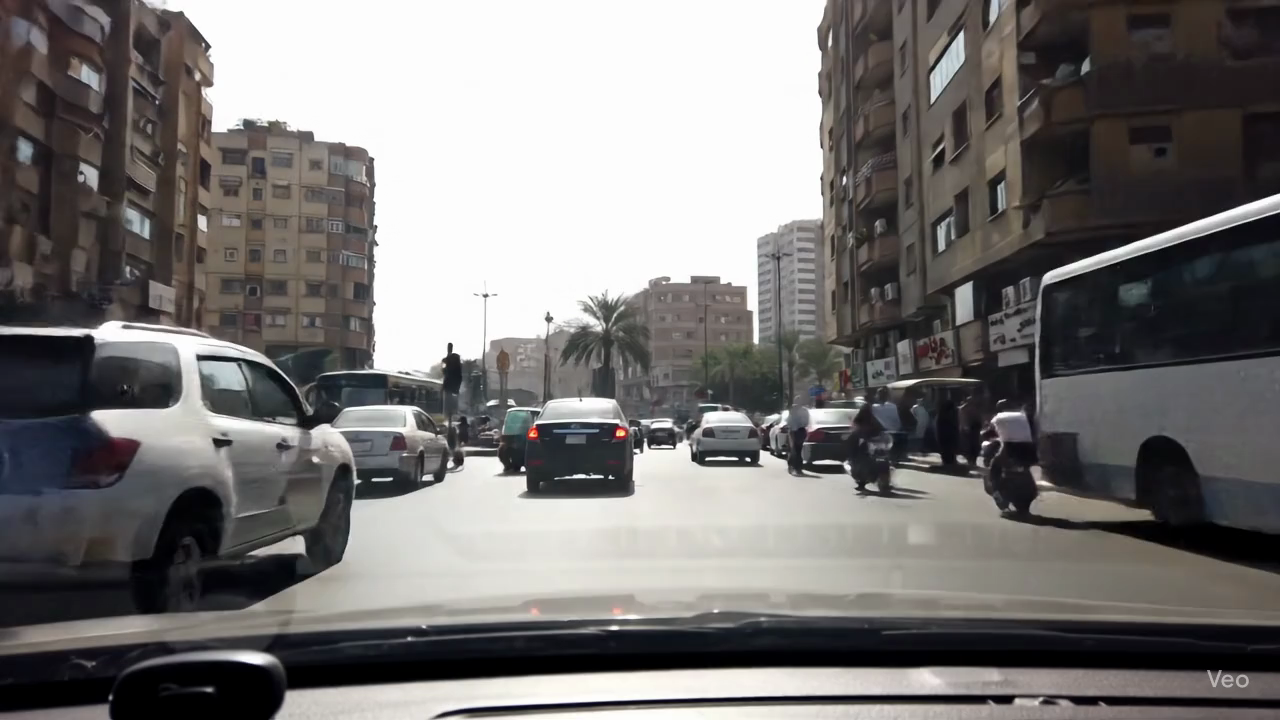
| Bangui (Central African Republic) | Cairo (Egypt) | Kampala (Uganda) | Kinshasa (DR Congo) |
 |
 |
 |
 |
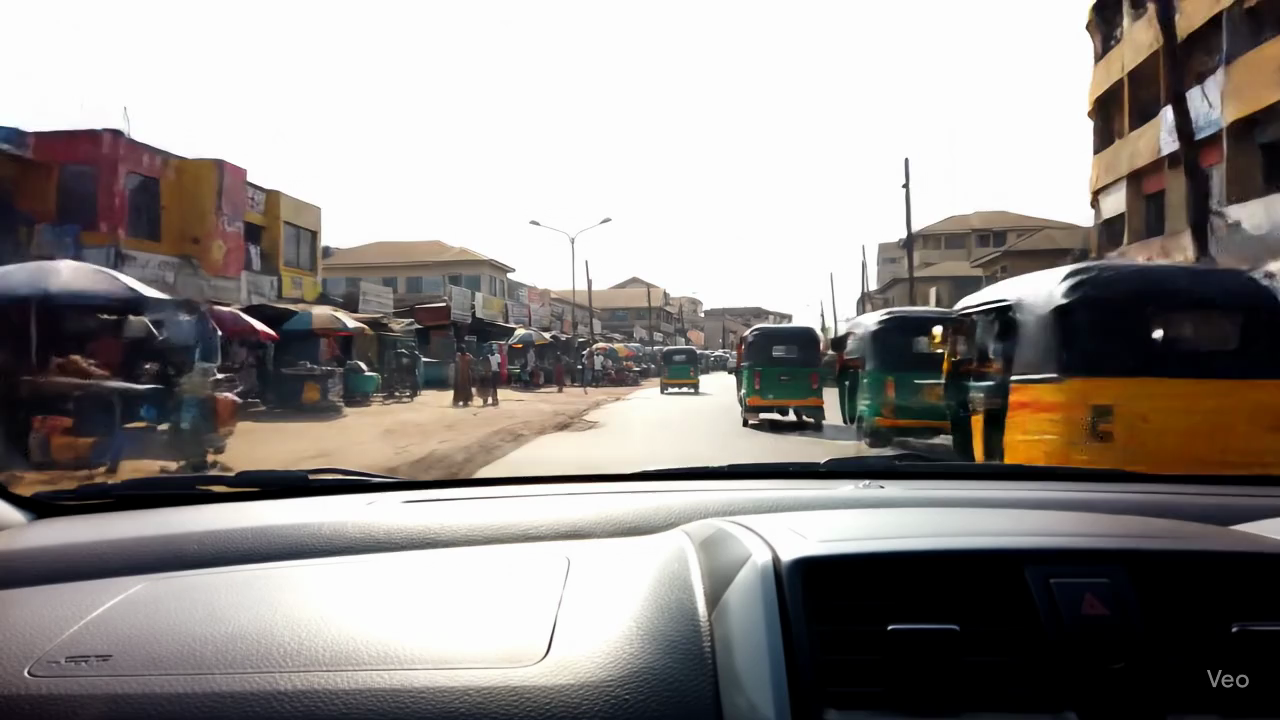
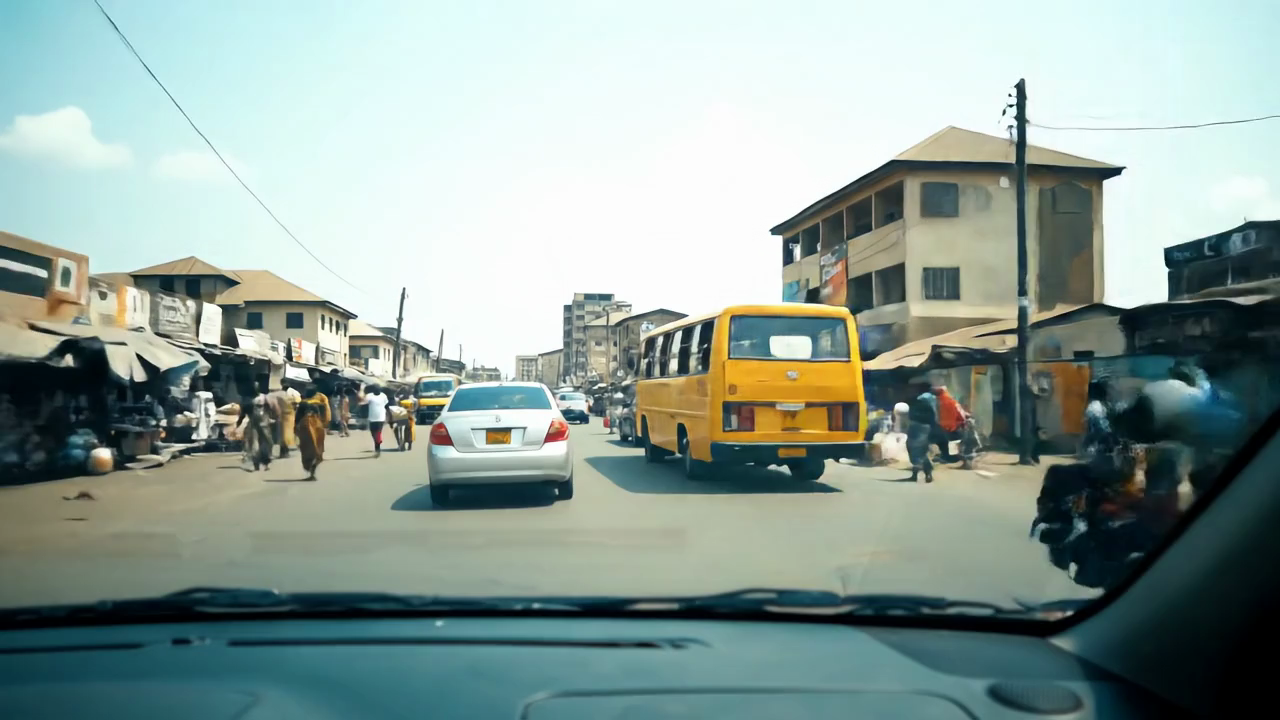
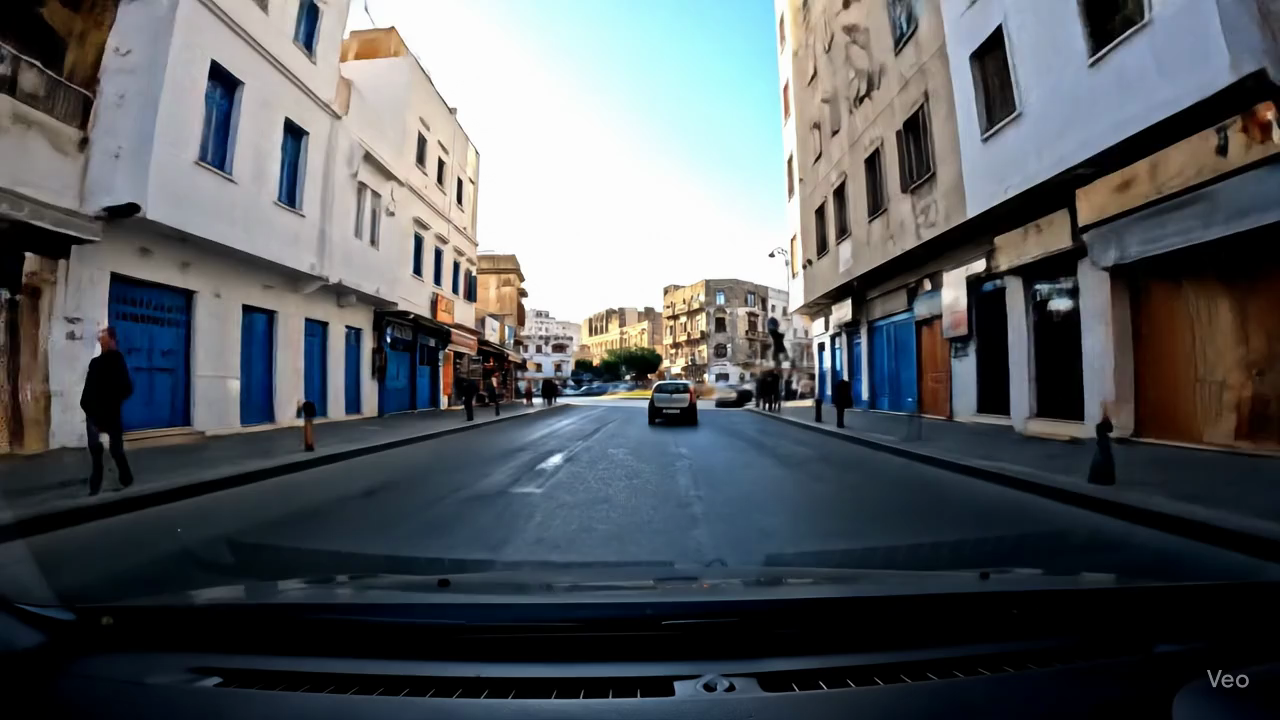
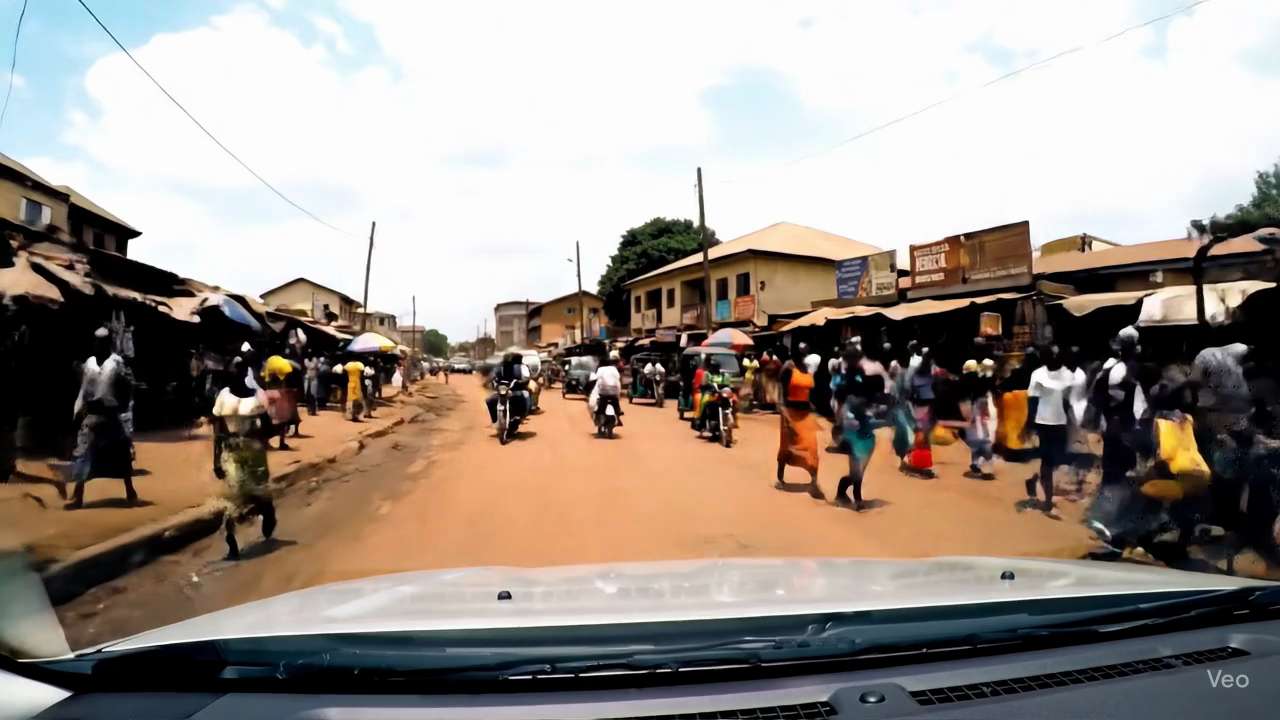
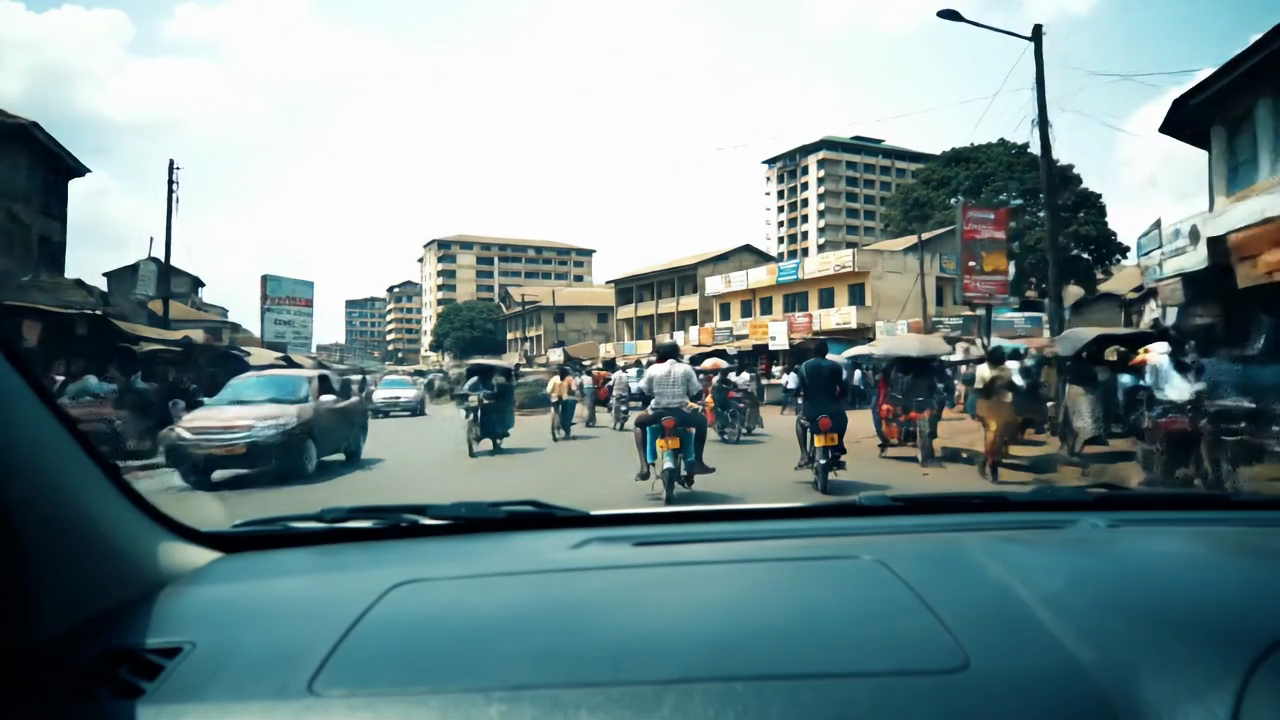
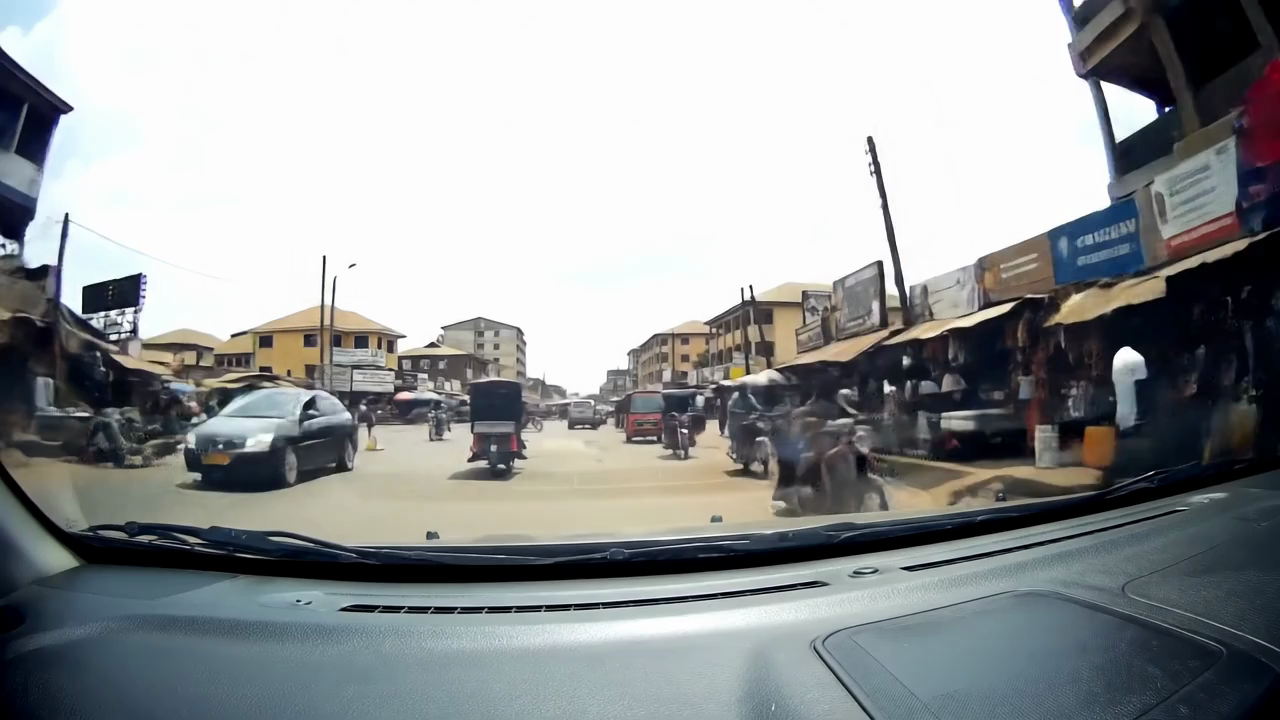
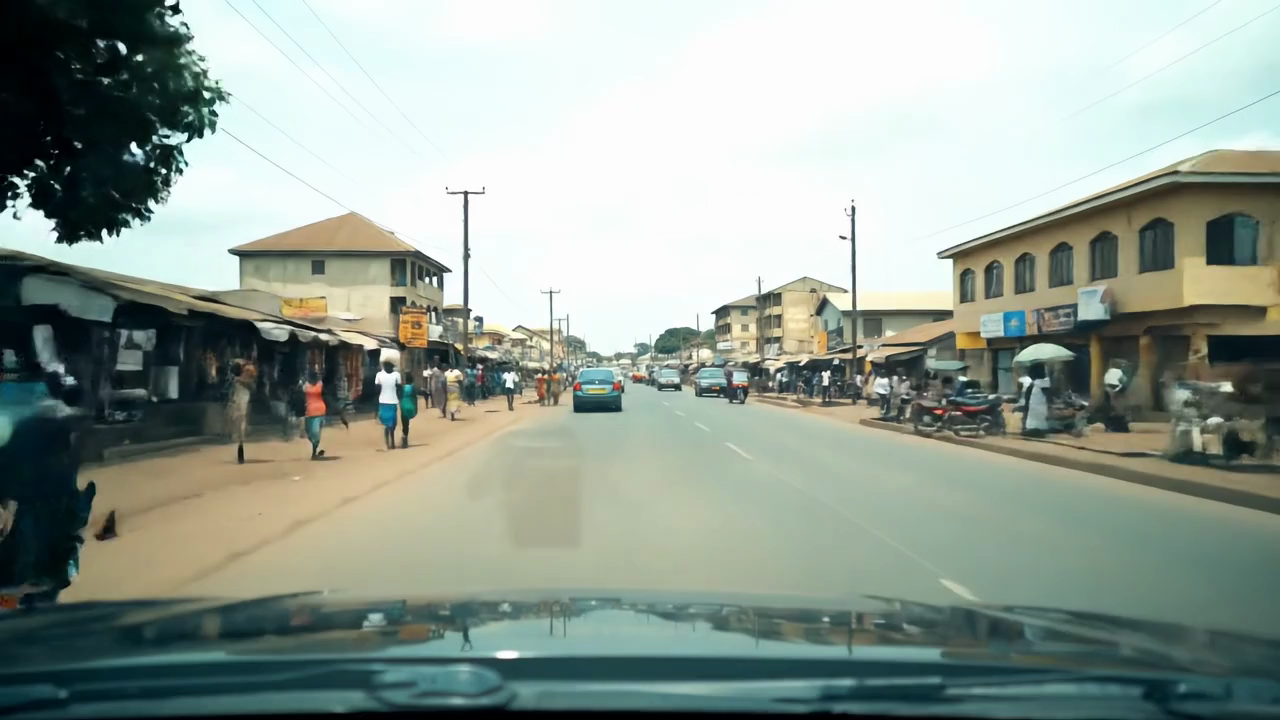
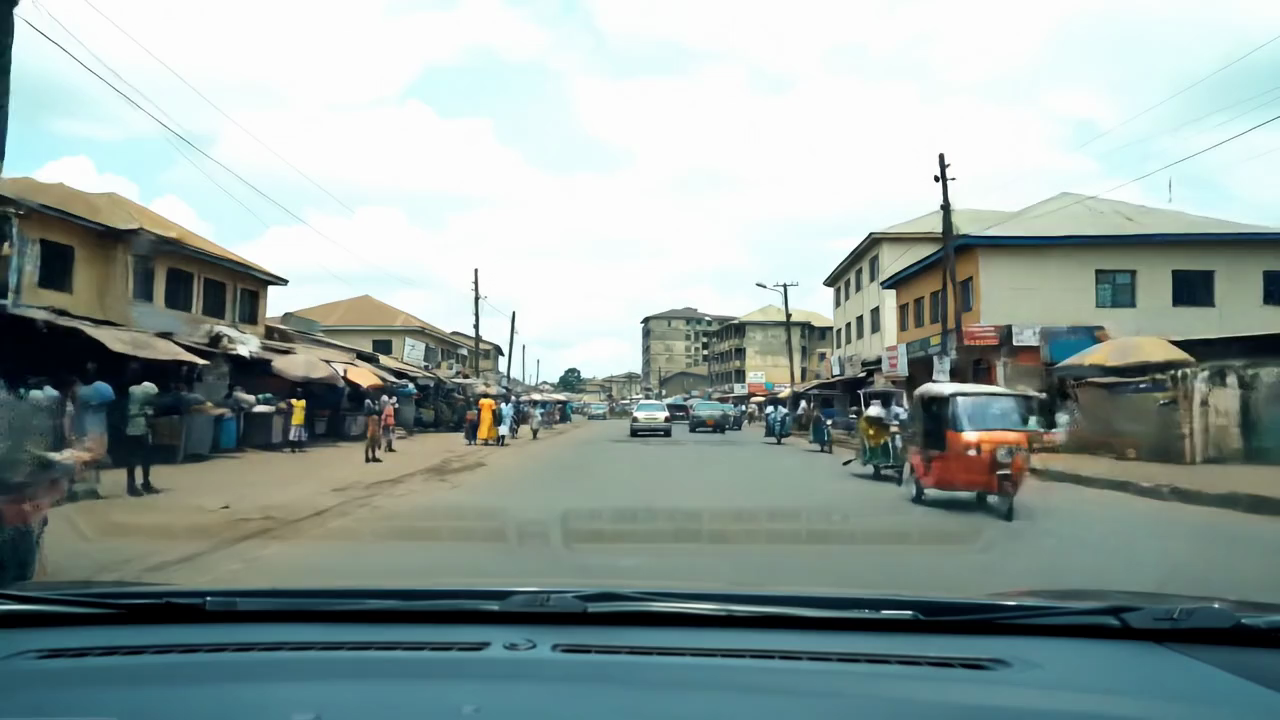
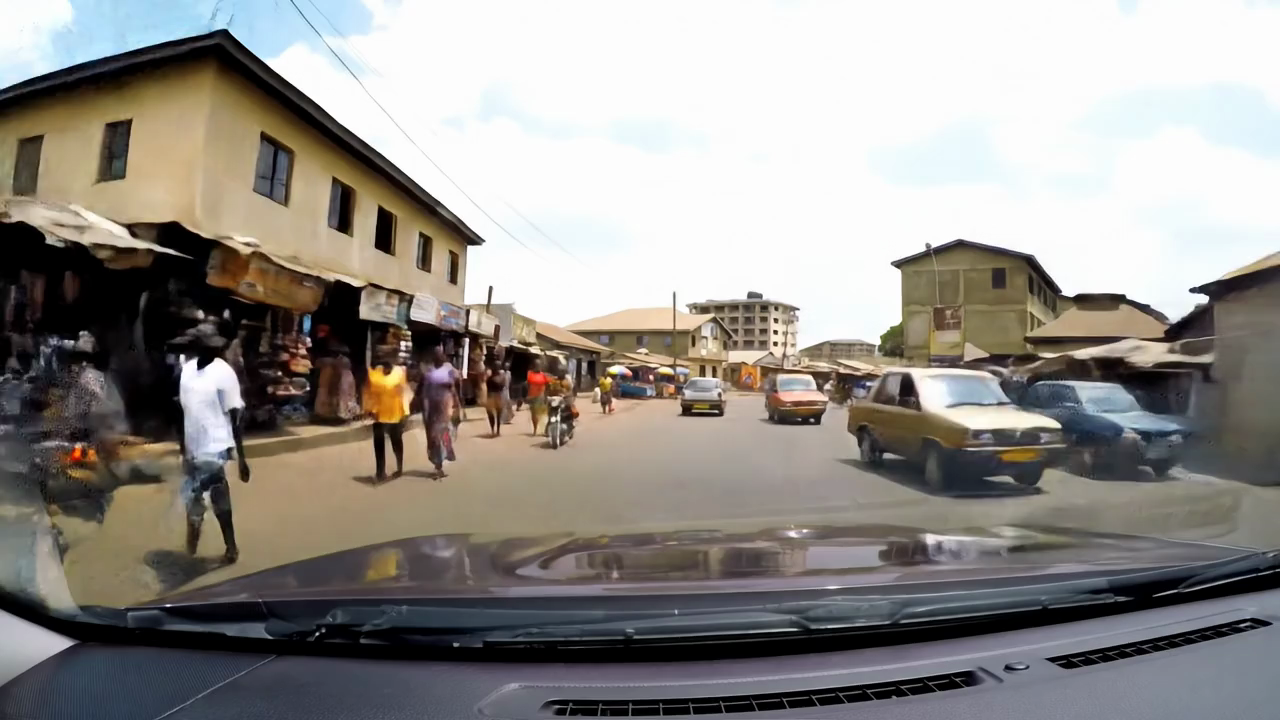
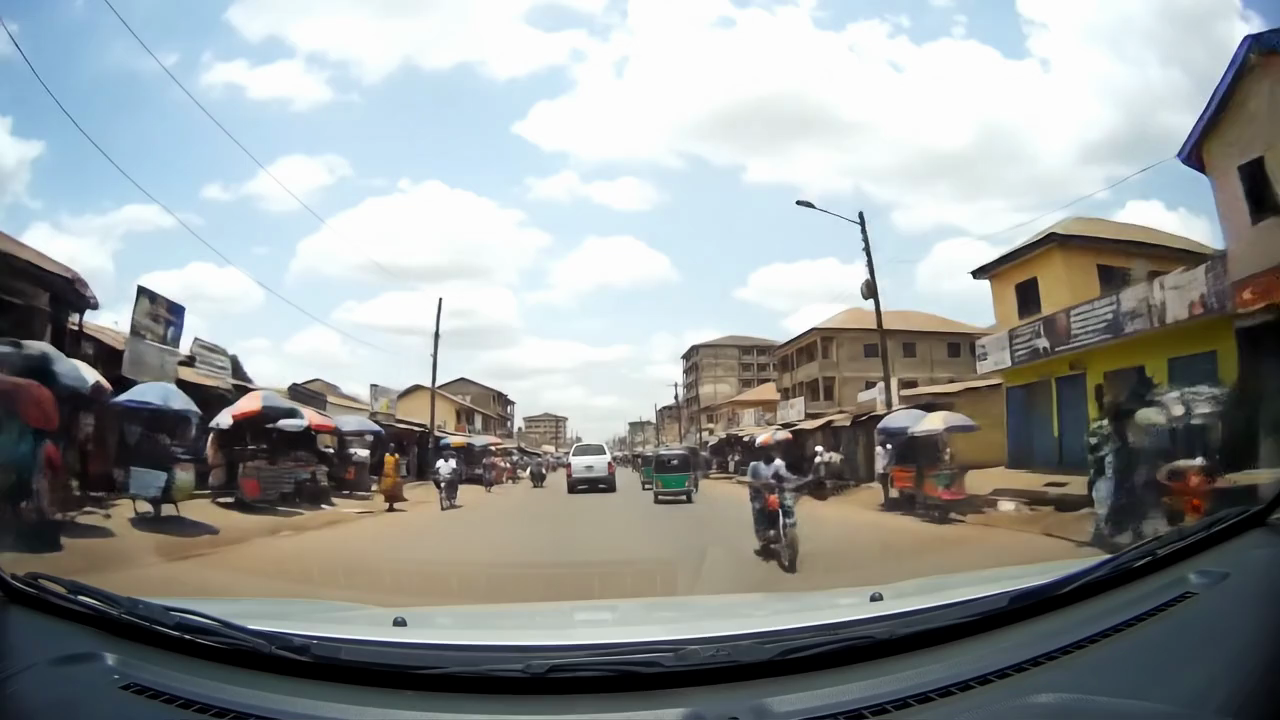
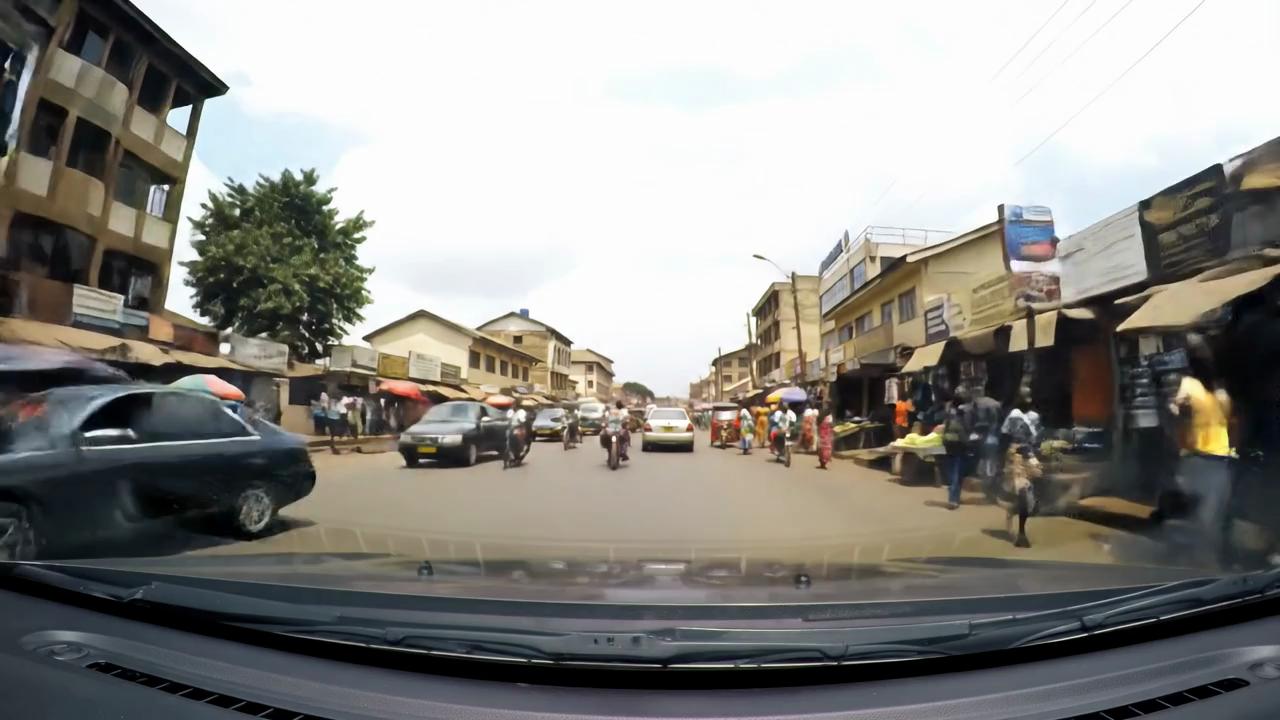
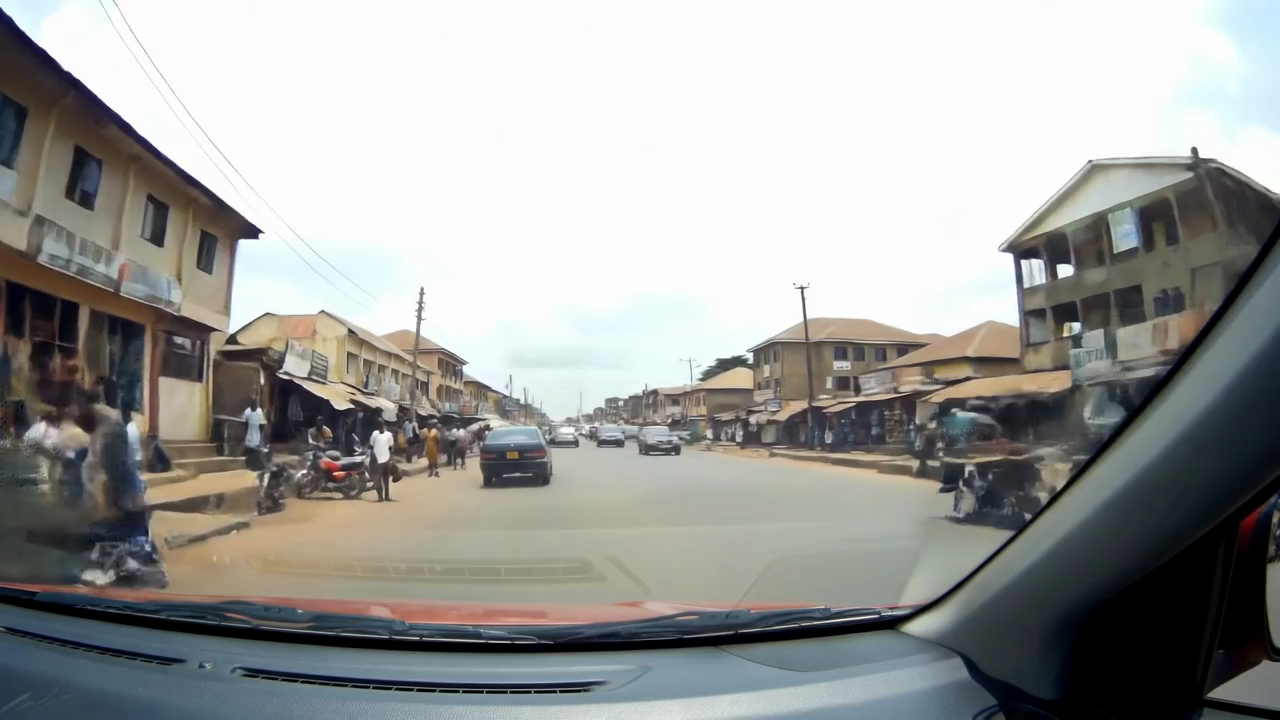
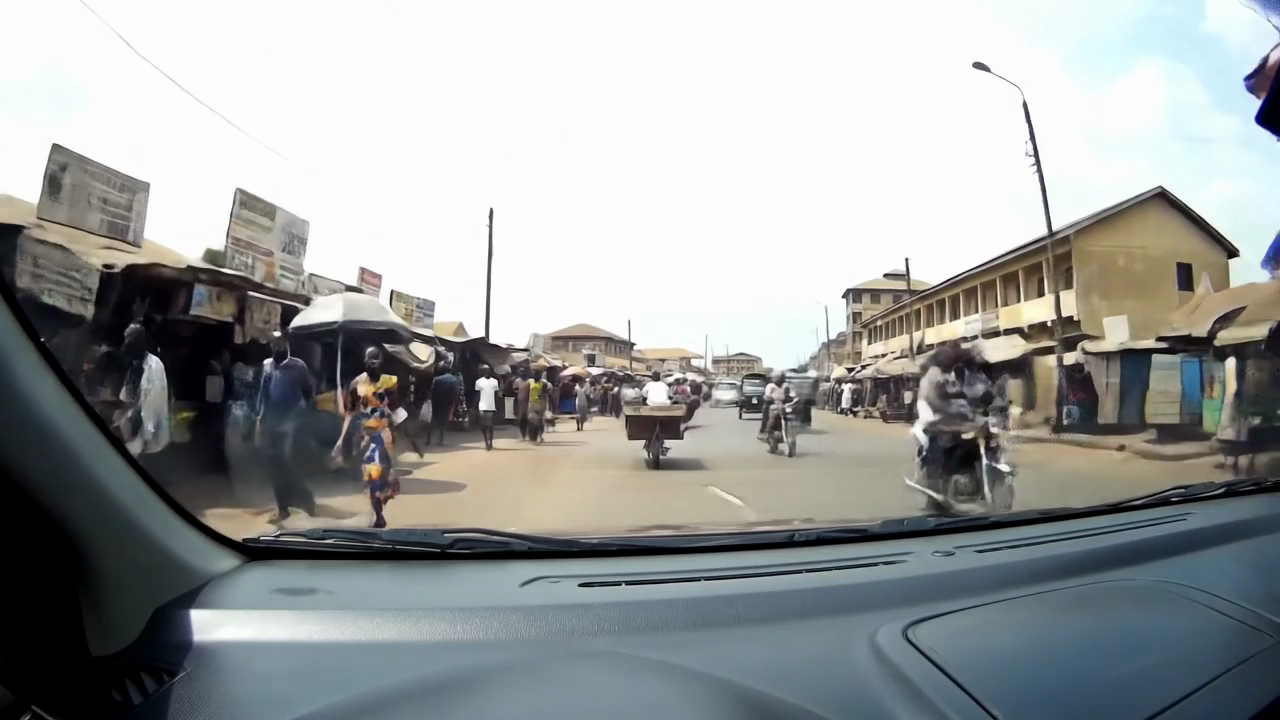
| Lagos (Nigeria) | N'Djamena (Chad) | Tunis (Tunisia) | Zanzibar (Tanzania) |
 |
 |
 |
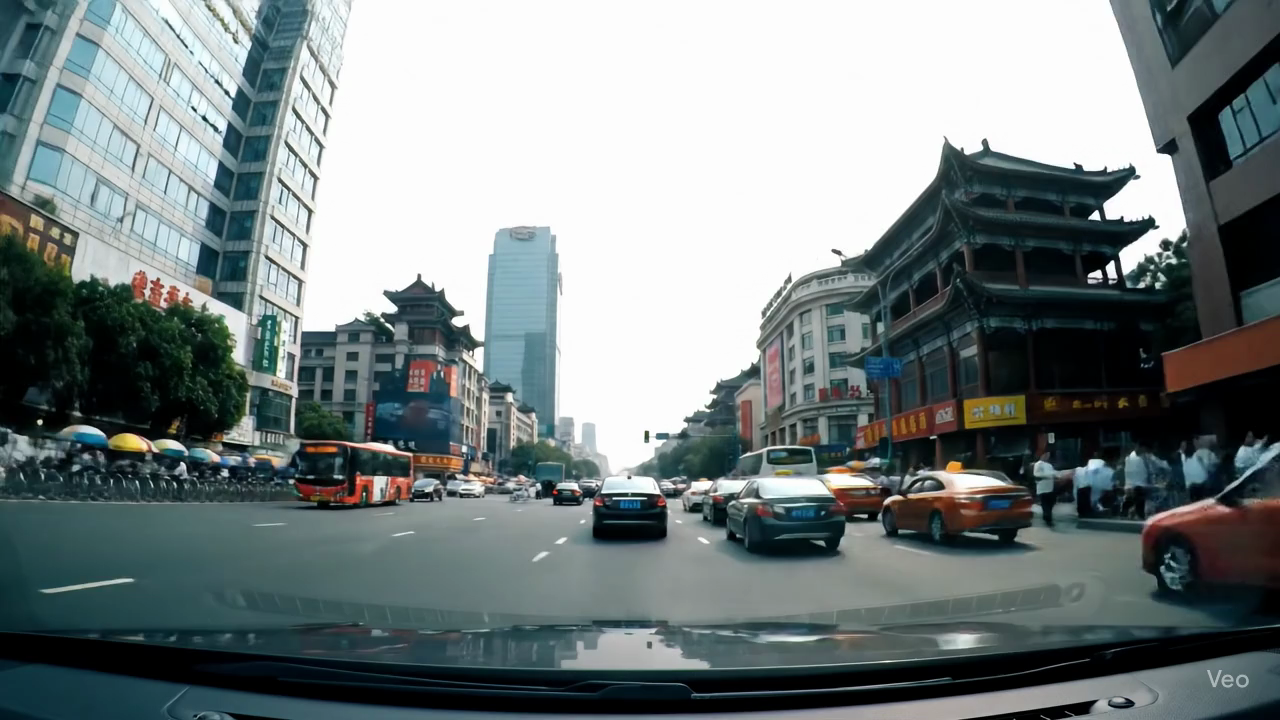 |
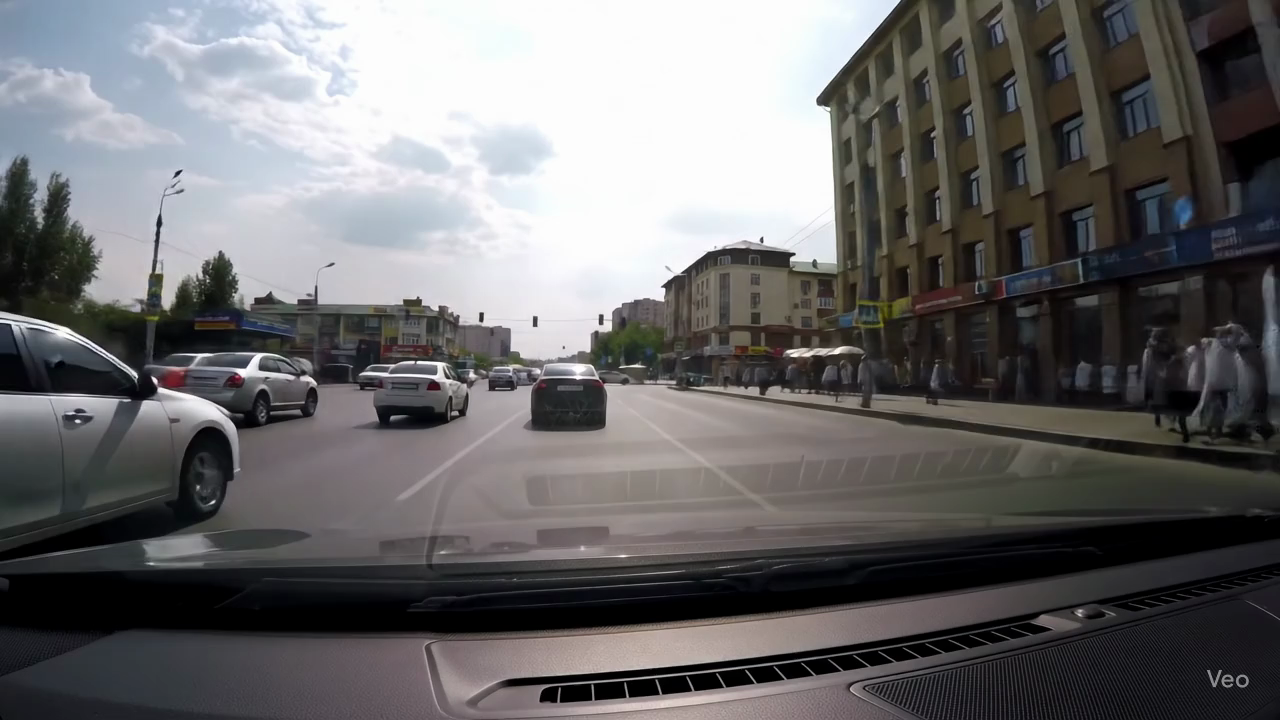
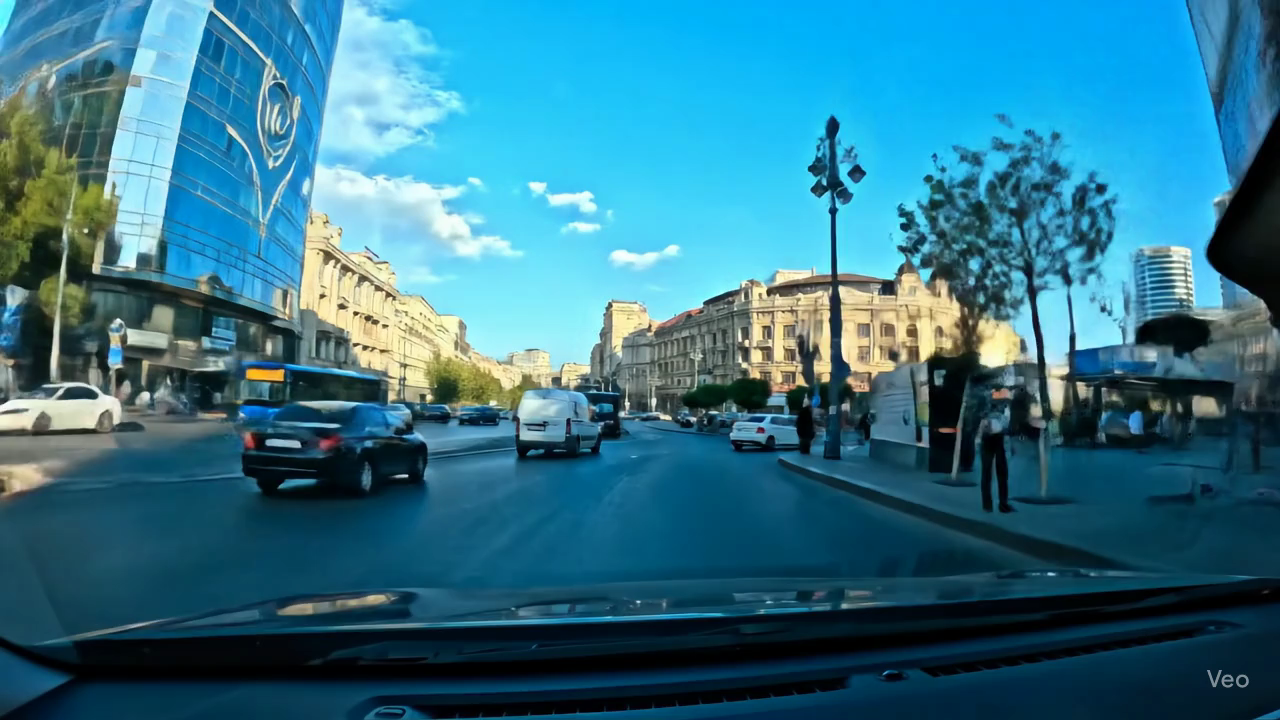
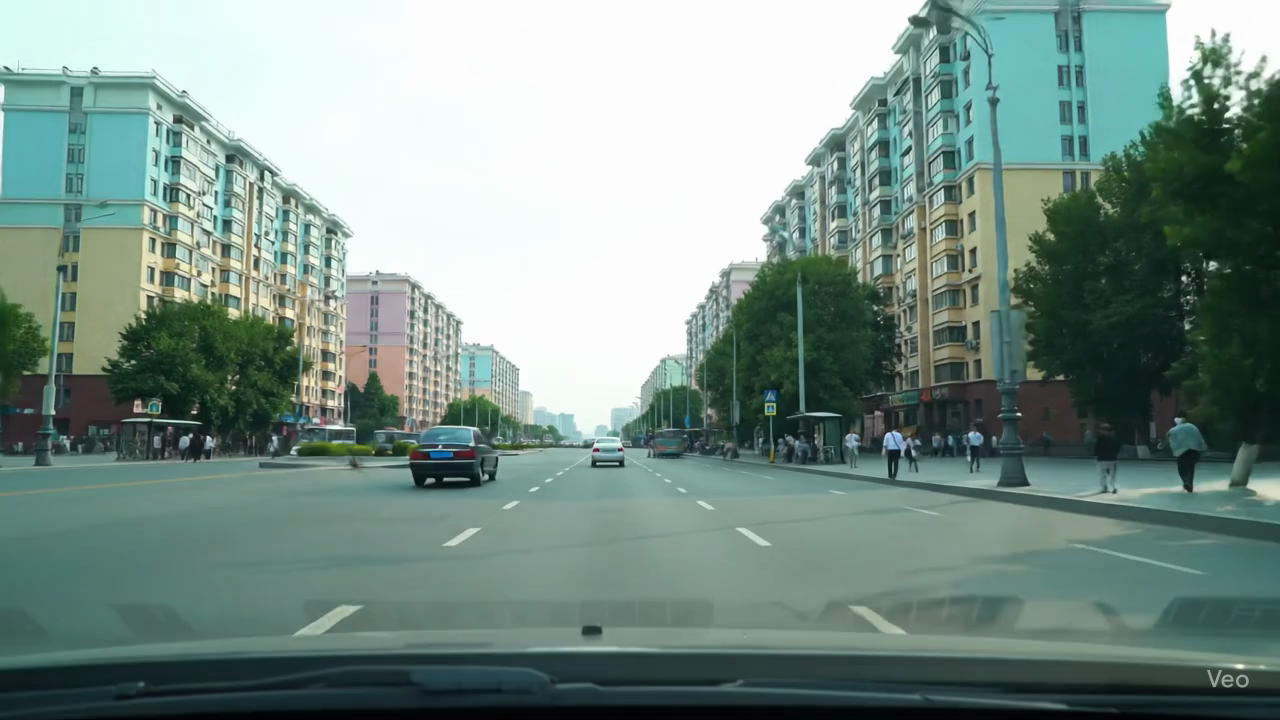
| Almaty (Kazakhstan) | Baghdad (Iraq) | Baku (Azerbaijan) | Beijing (China) |
 |
 |
 |
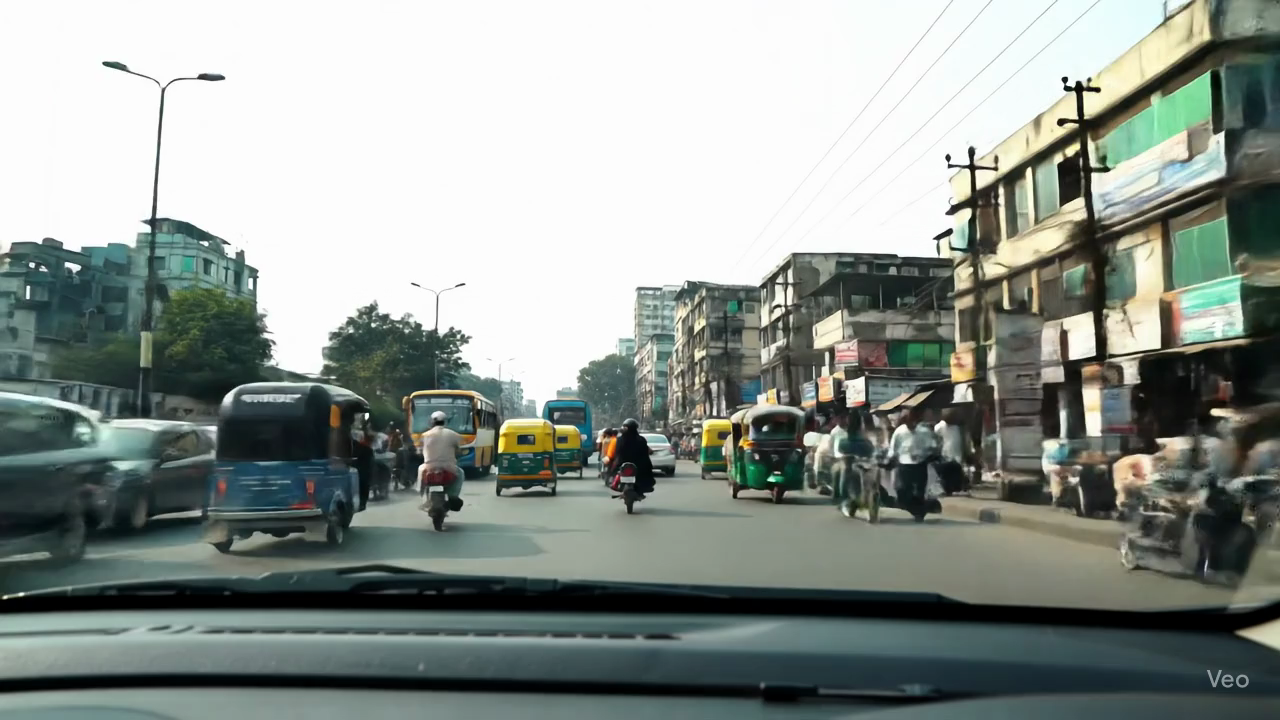 |
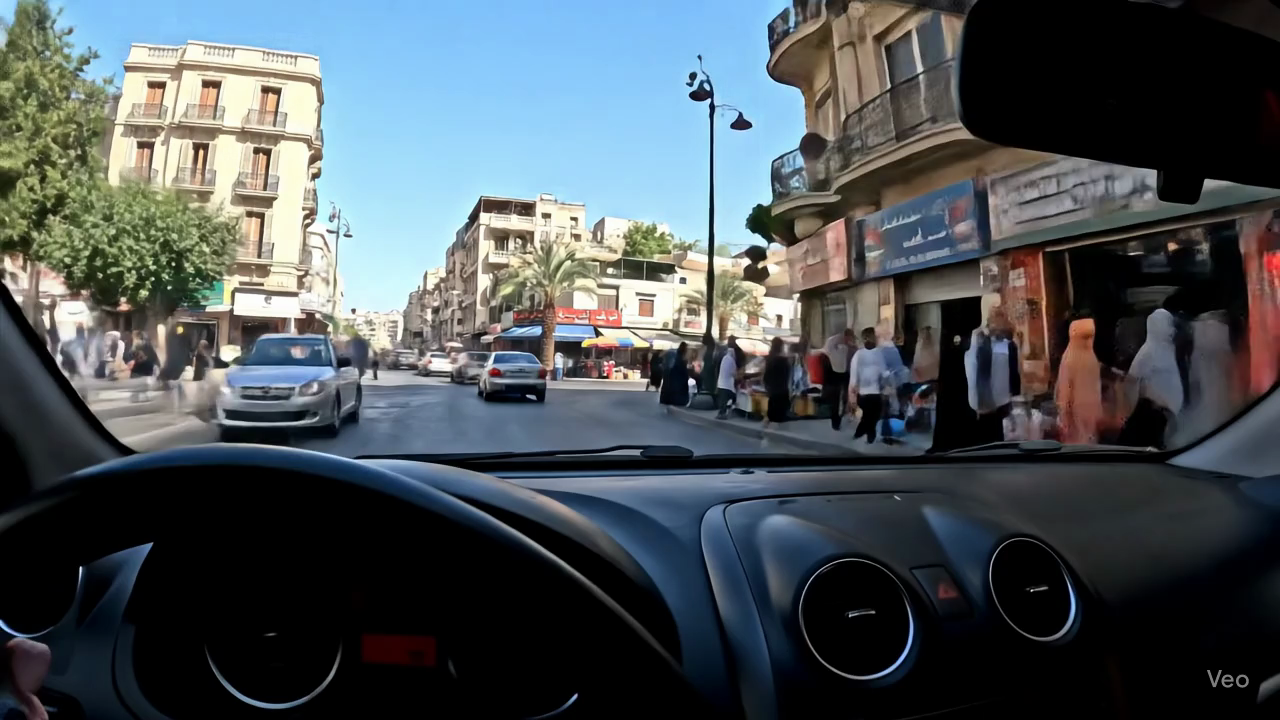
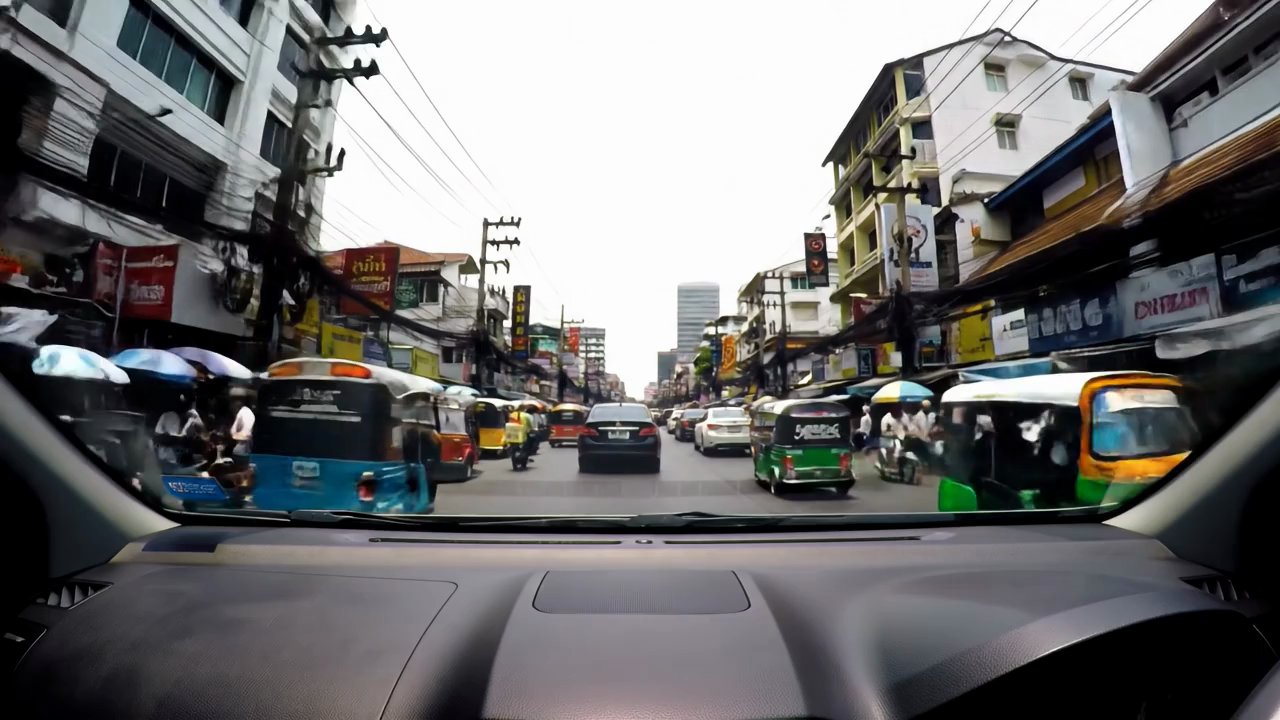
| Bangkok (Thailand) | Colombo (Sri Lanka) | Damascus (Syria) | Dhaka (Bangladesh) |
 |
 |
 |
 |
| Doha (Qatar) | Dubai (United Arab Emirates) | Istanbul (Türkiye.png) | Jakarta (Indonesia) |
 |
 |
 |
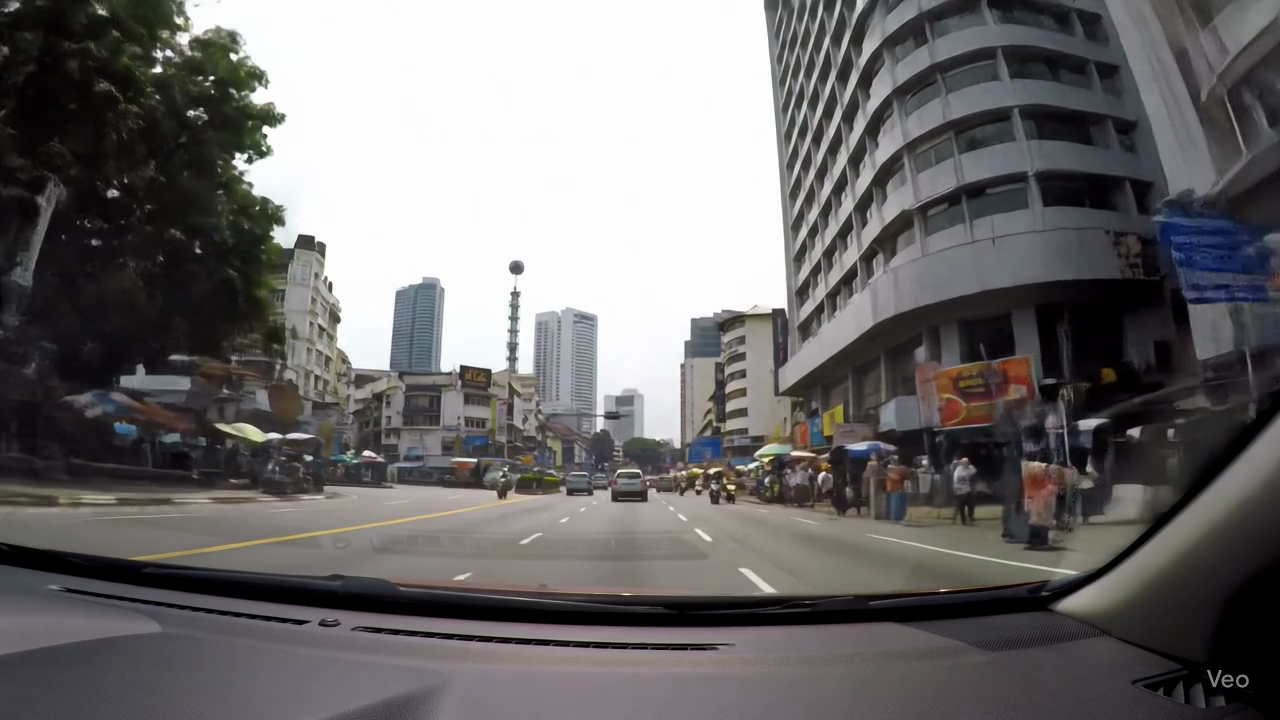 |
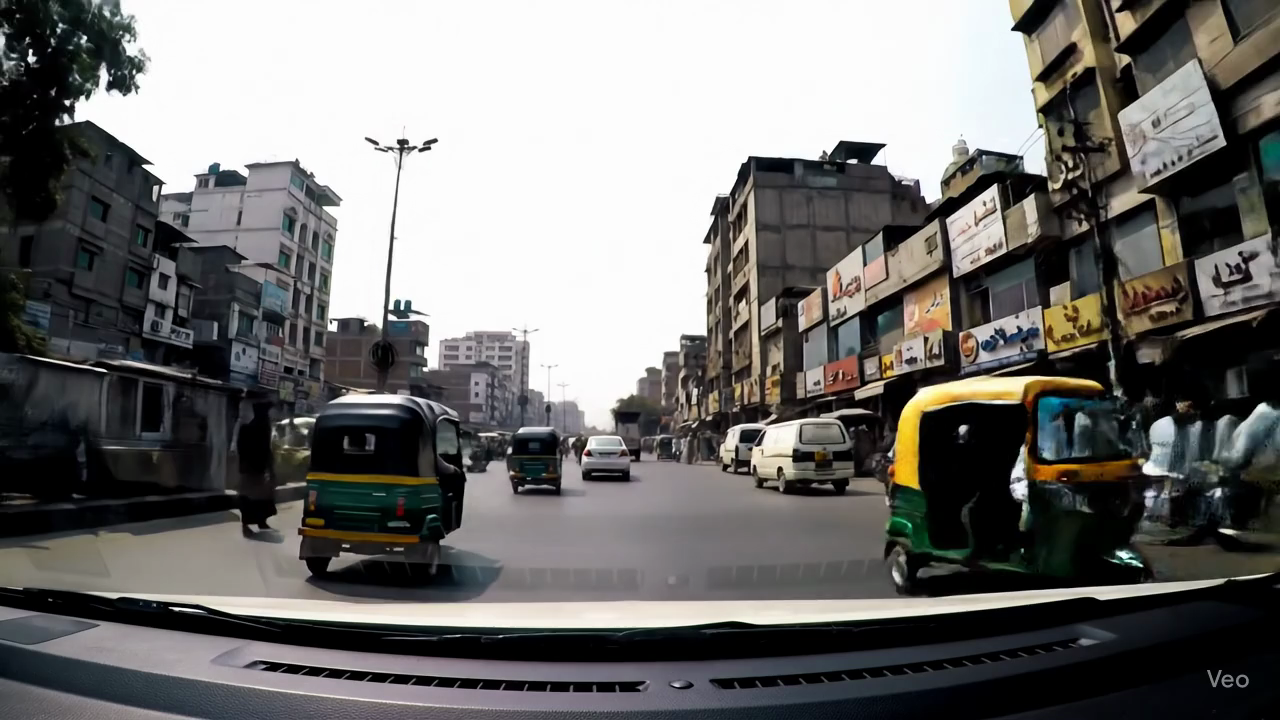
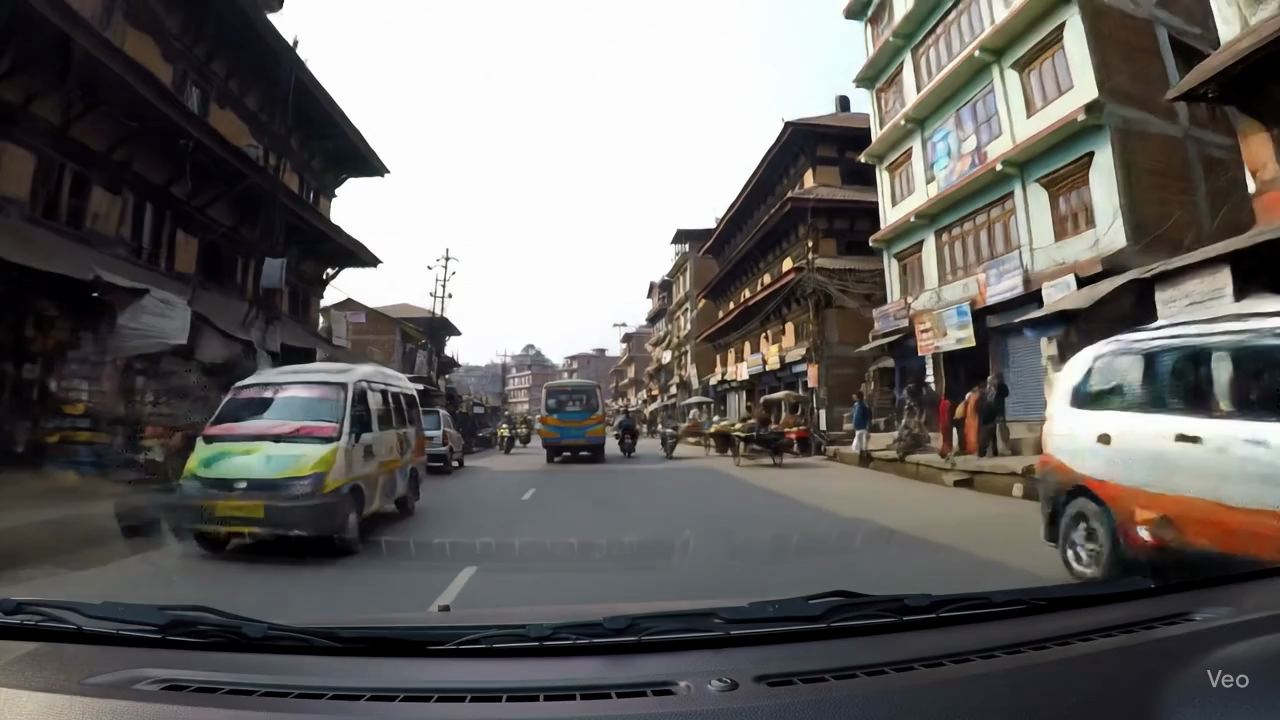
| Kabul (Afghanistan) | Karachi (Pakistan) | Kathmandu (Nepal) | Kuala Lumpur (Malaysia) |
 |
 |
 |
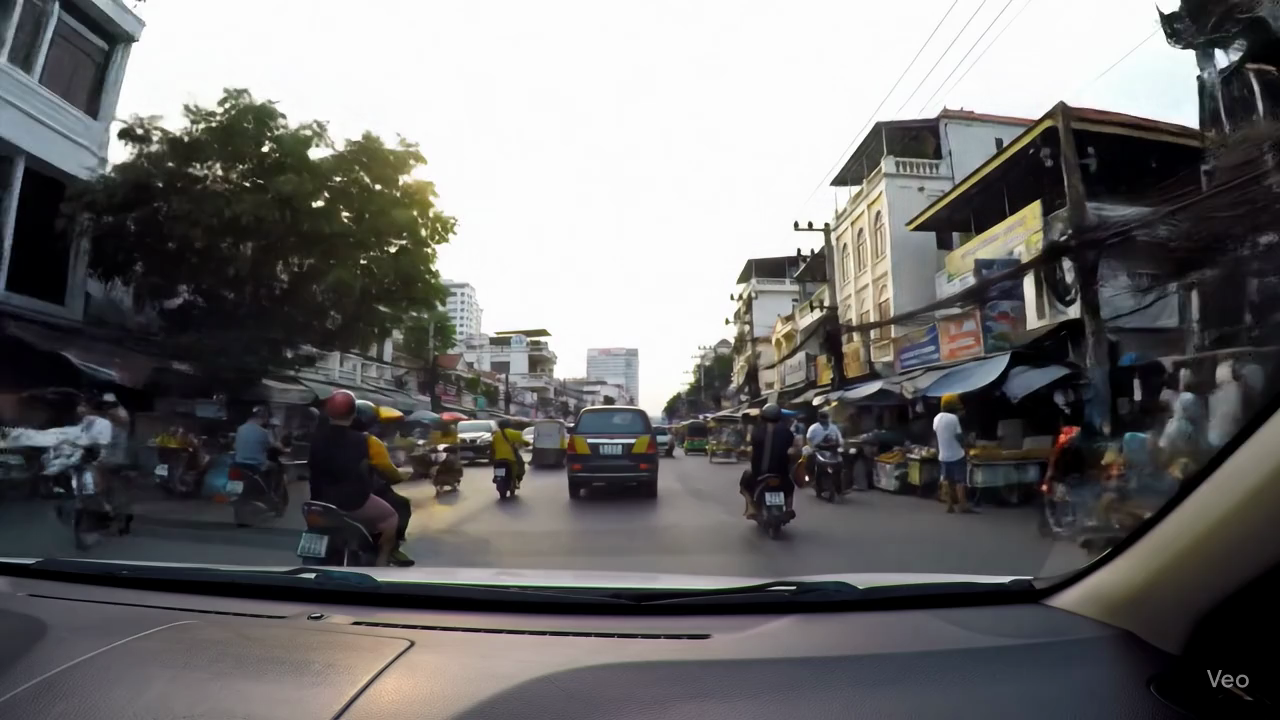 |
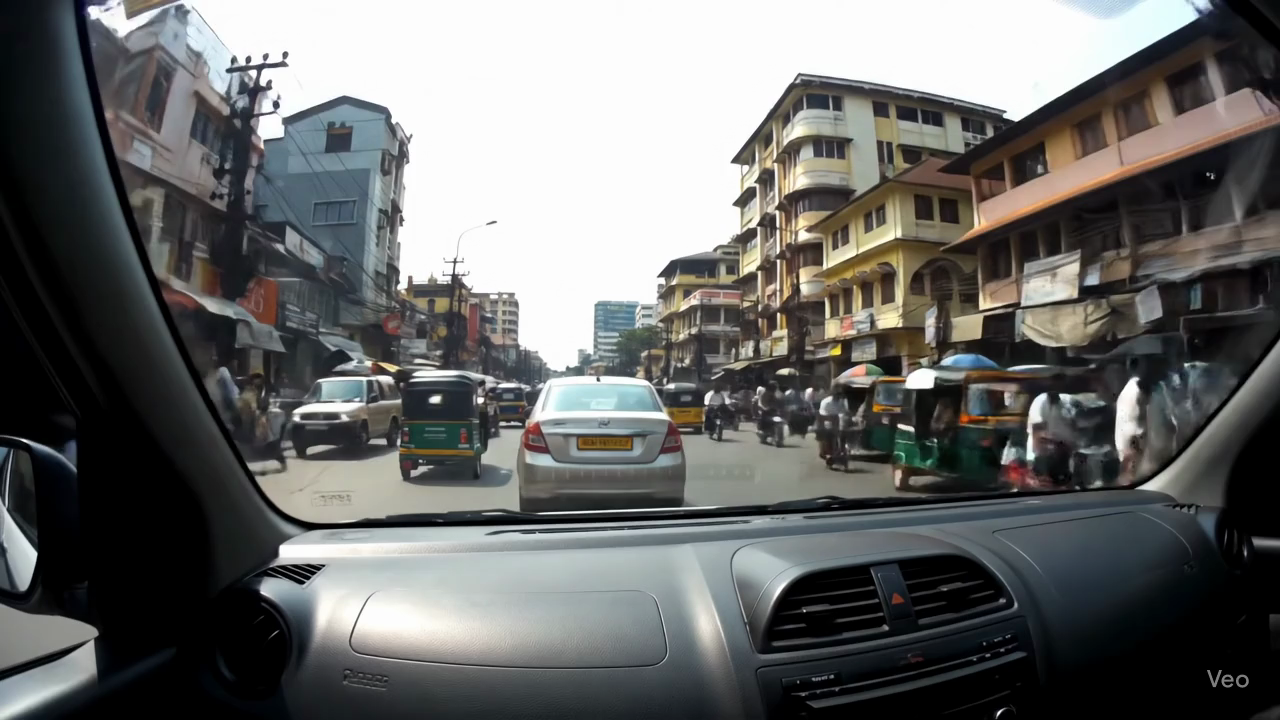
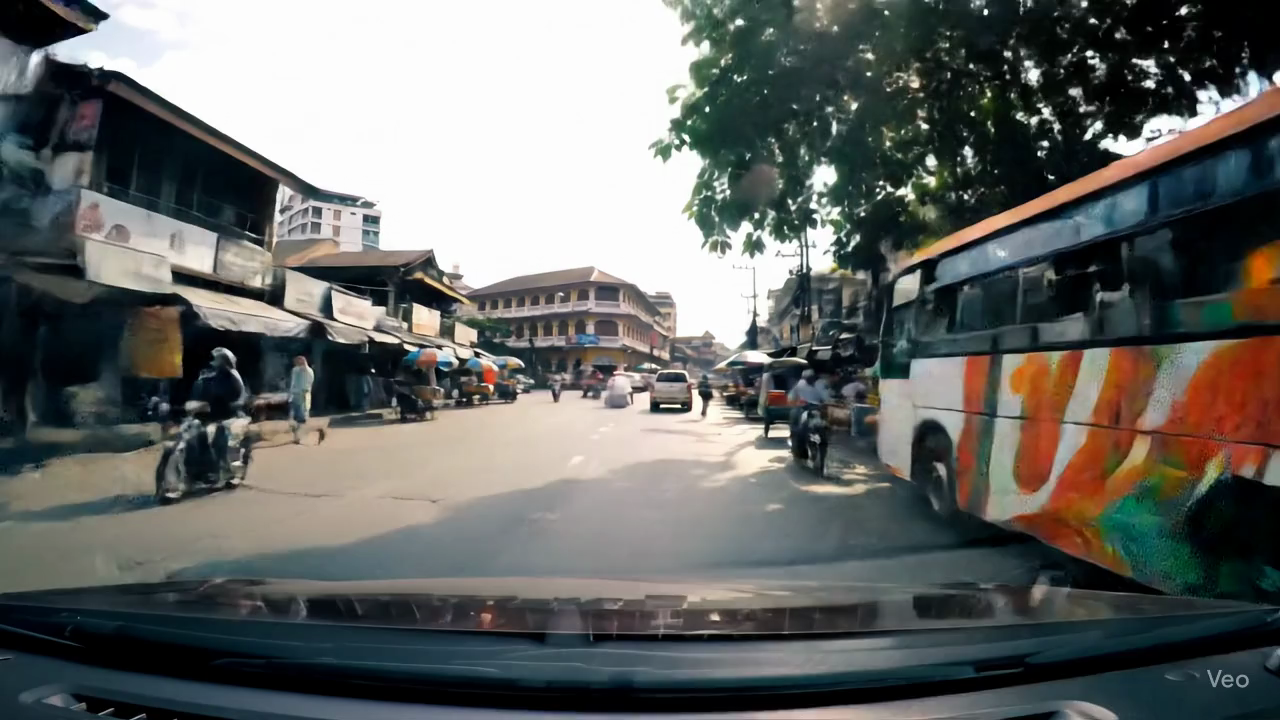
| Malé (Maldives) | Mumbai (India) | Muscat (Oman) | Phnom Penh (Cambodia) |
 |
 |
 |
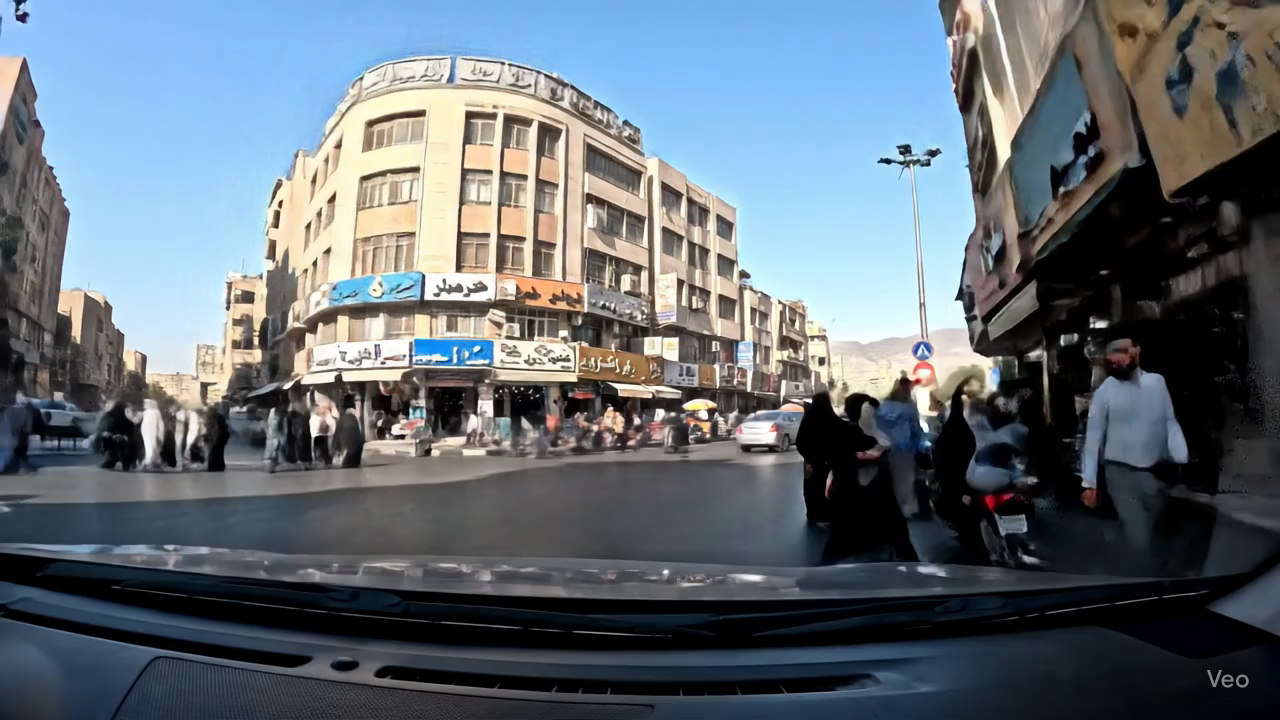 |
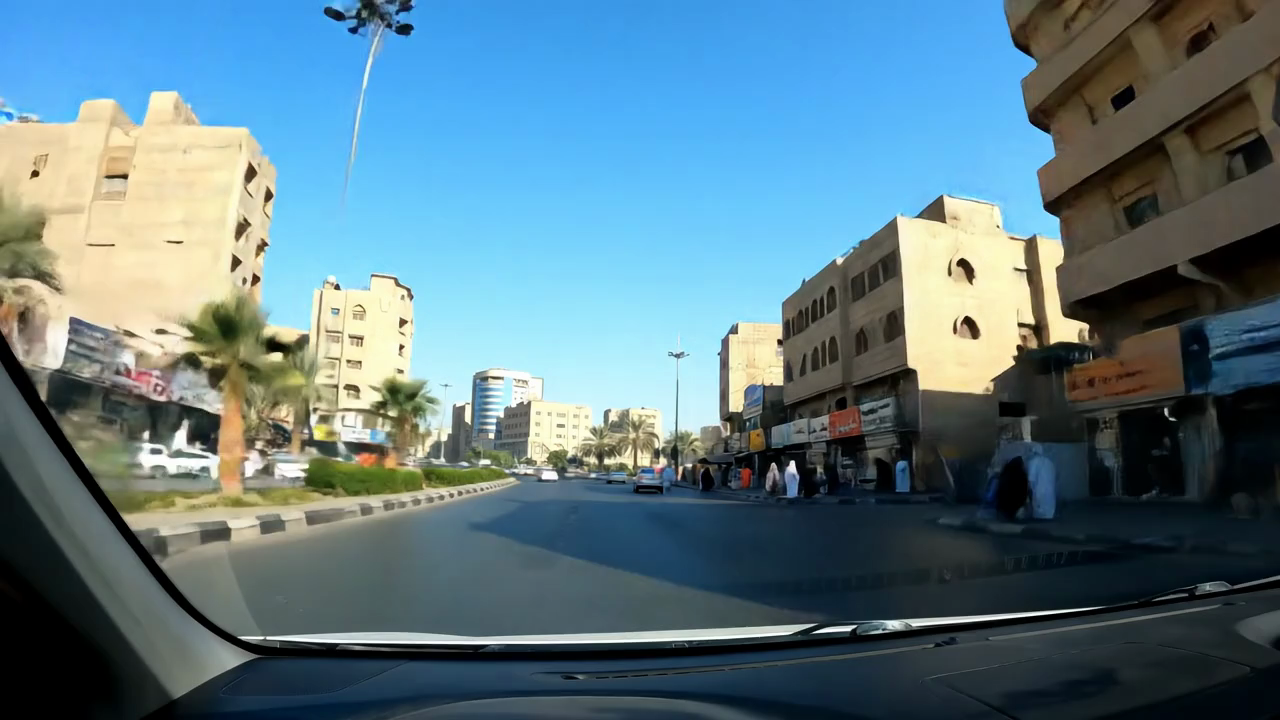
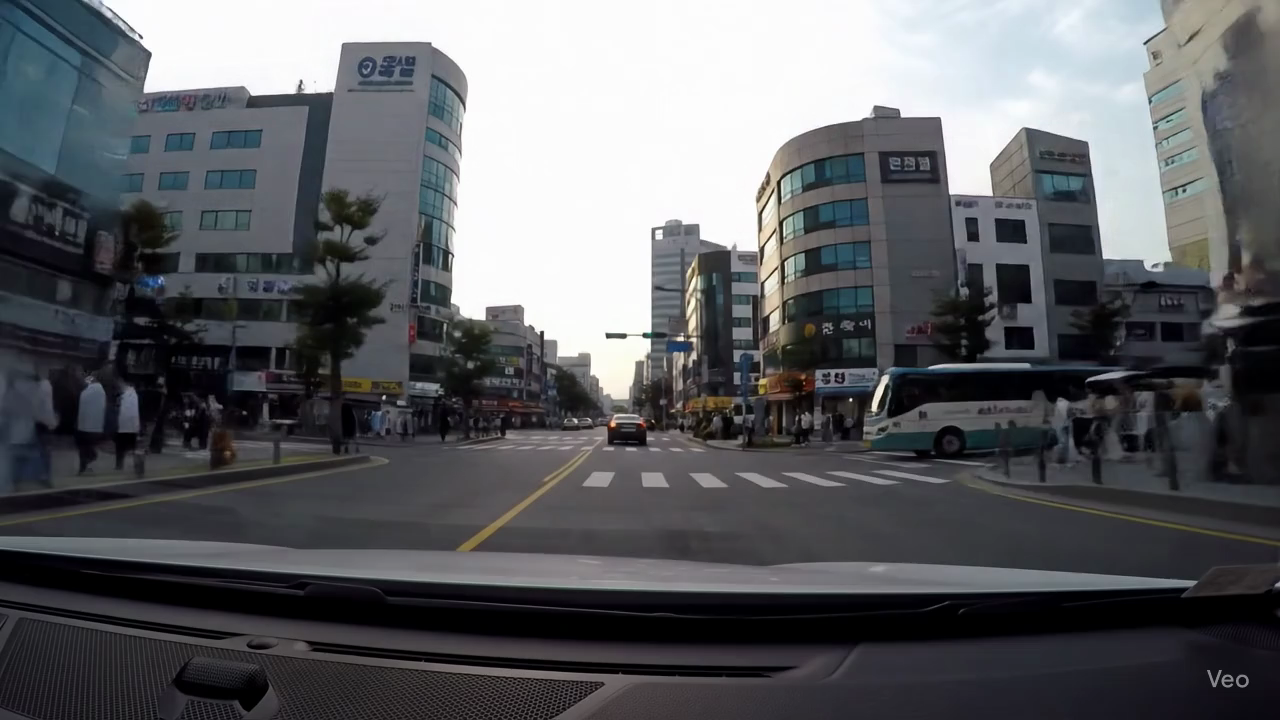
| Pyongyang (North Korea) | Riyadh (Saudi Arabia) | Seoul (South Korea) | Tehran (Iran) |
 |
 |
 |
|
| Tel Aviv (Israel) | Tokyo (Japan) | Yangon (Myanmar) |
 |
 |
 |
 |
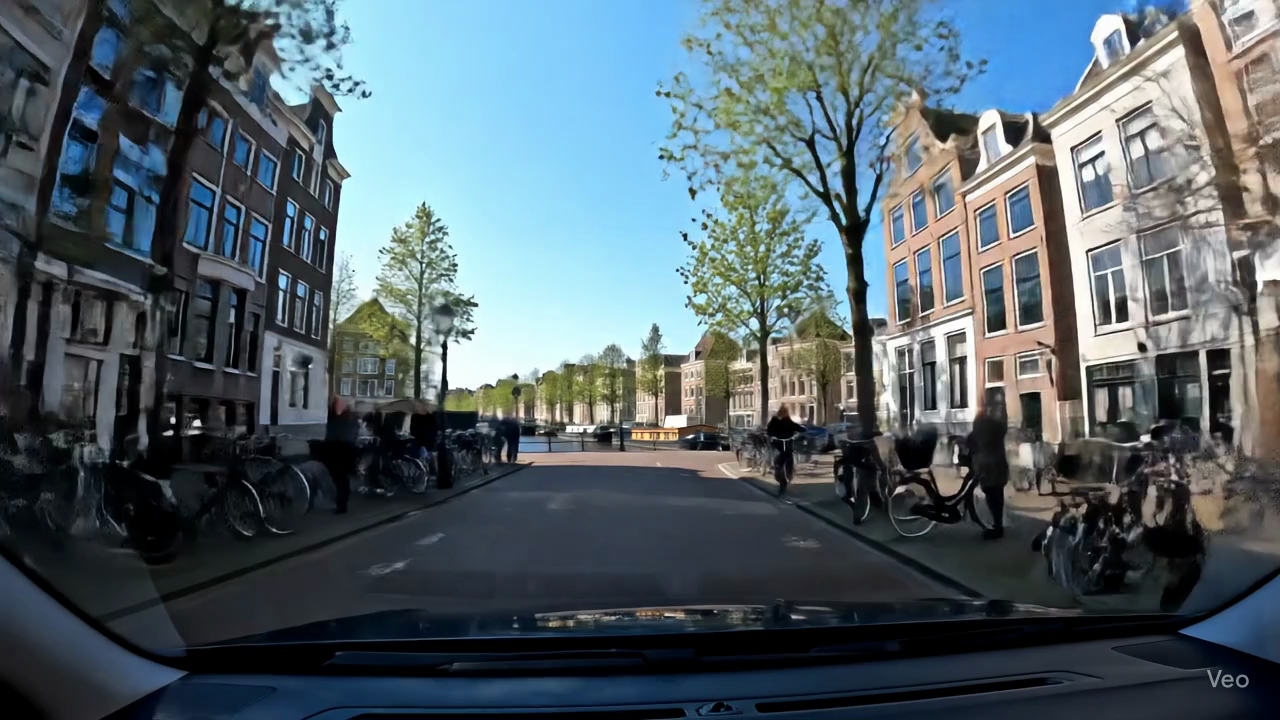
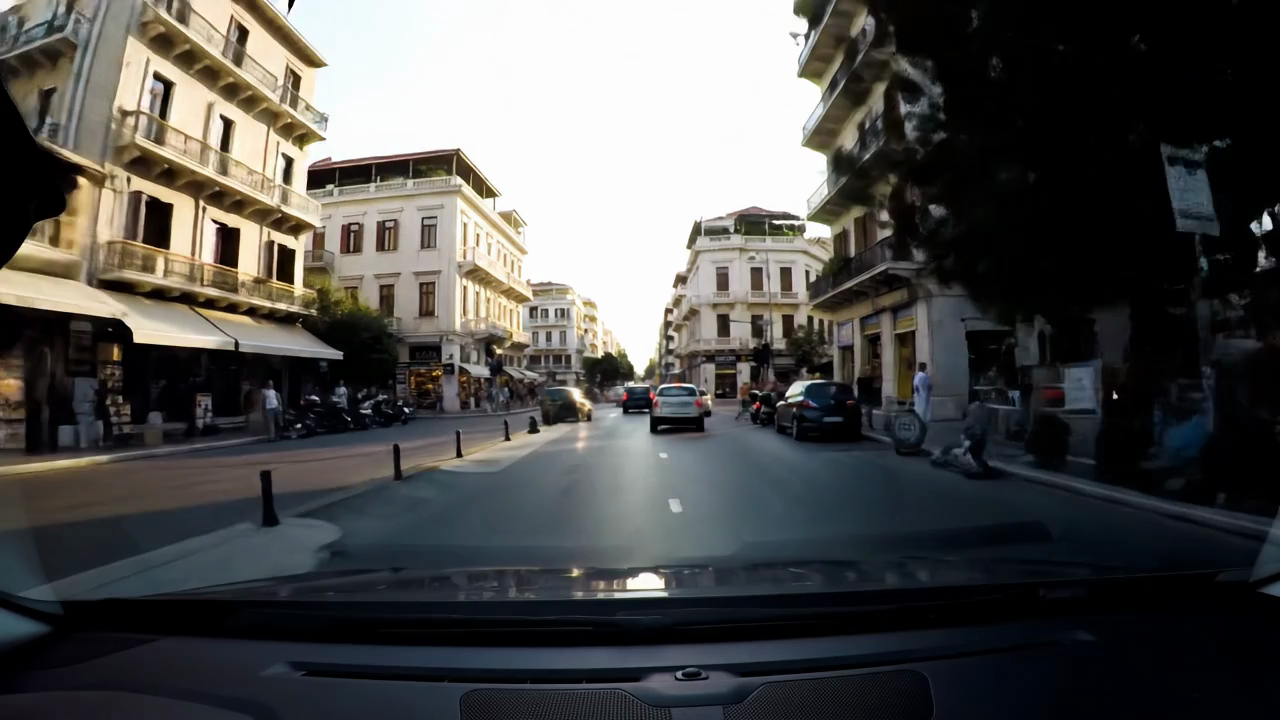
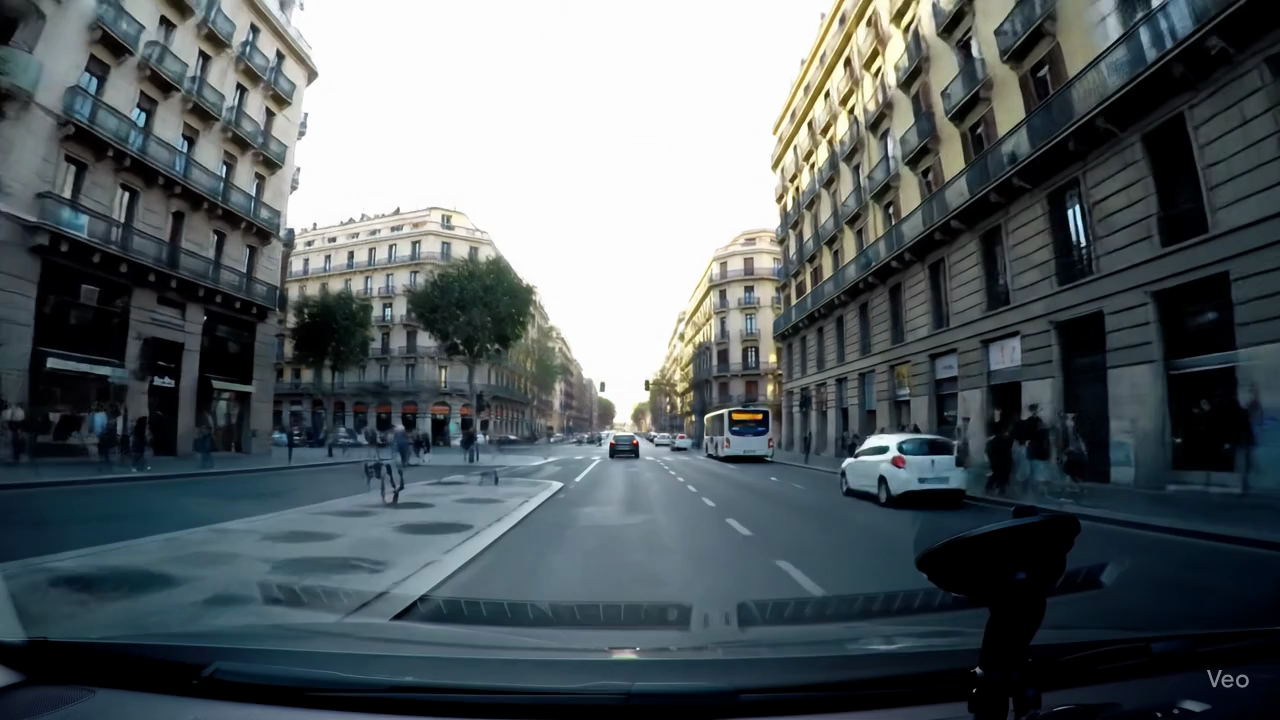
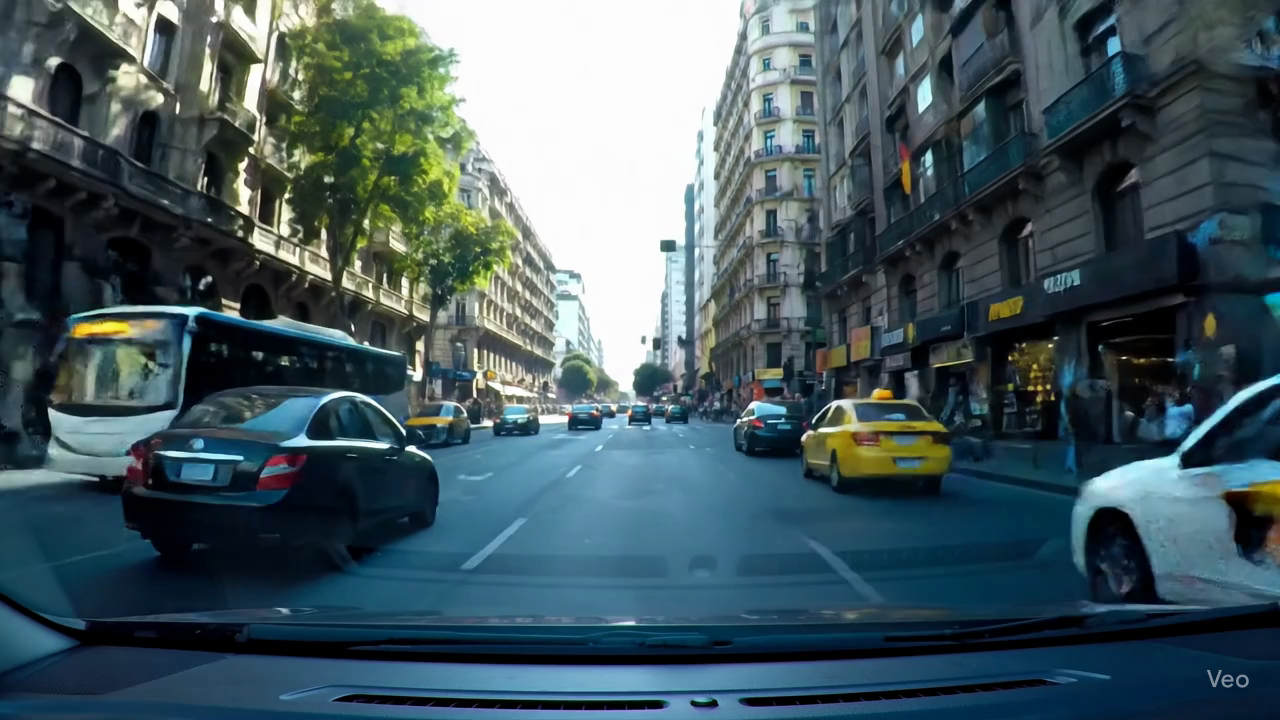
| Amsterdam (The Netherlands) | Athens (Greece) | Barcelona (Spain) | Berlin (Germany) |
 |
 |
 |
 |
| Brussels (Belgium) | Copenhagen (Denmark) | Dubrovnik (Croatia) | Helsinki (Finland) |
 |
 |
 |
 |
| Kyiv (Ukraine) | Lisbon (Portugal) | London (United Kingdom) | Moscow (Russia) |
 |
 |
 |
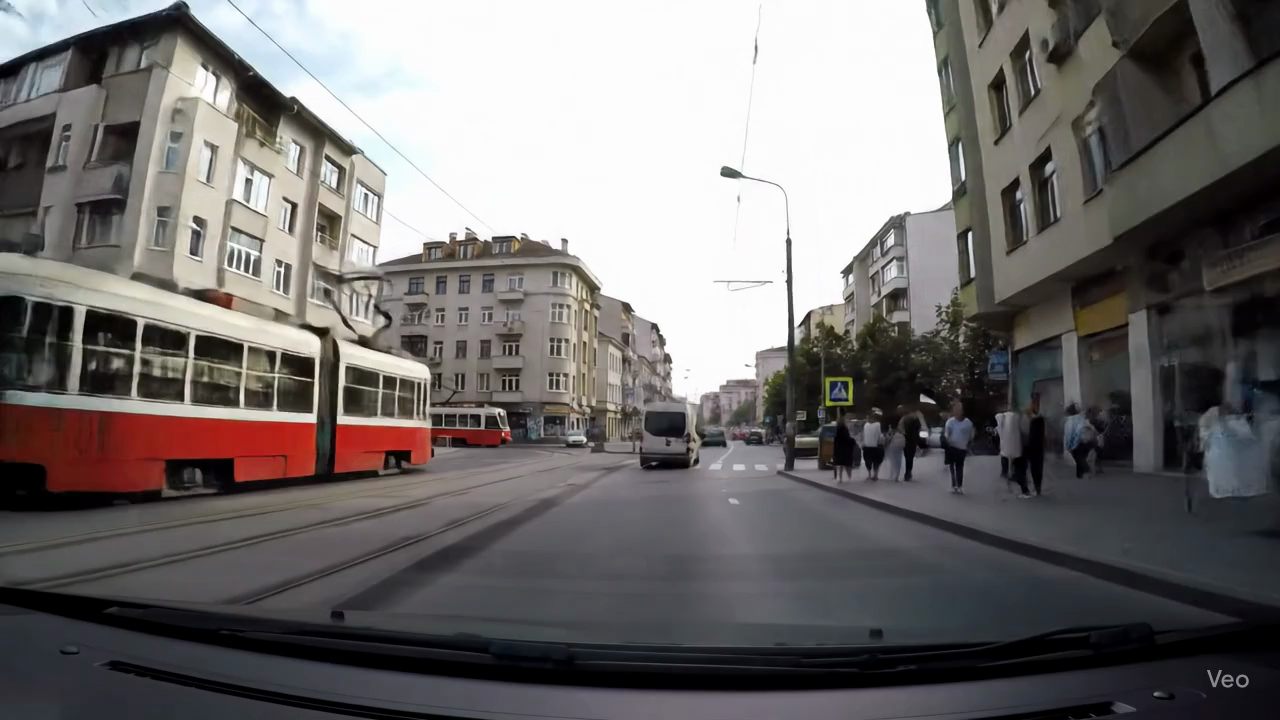 |
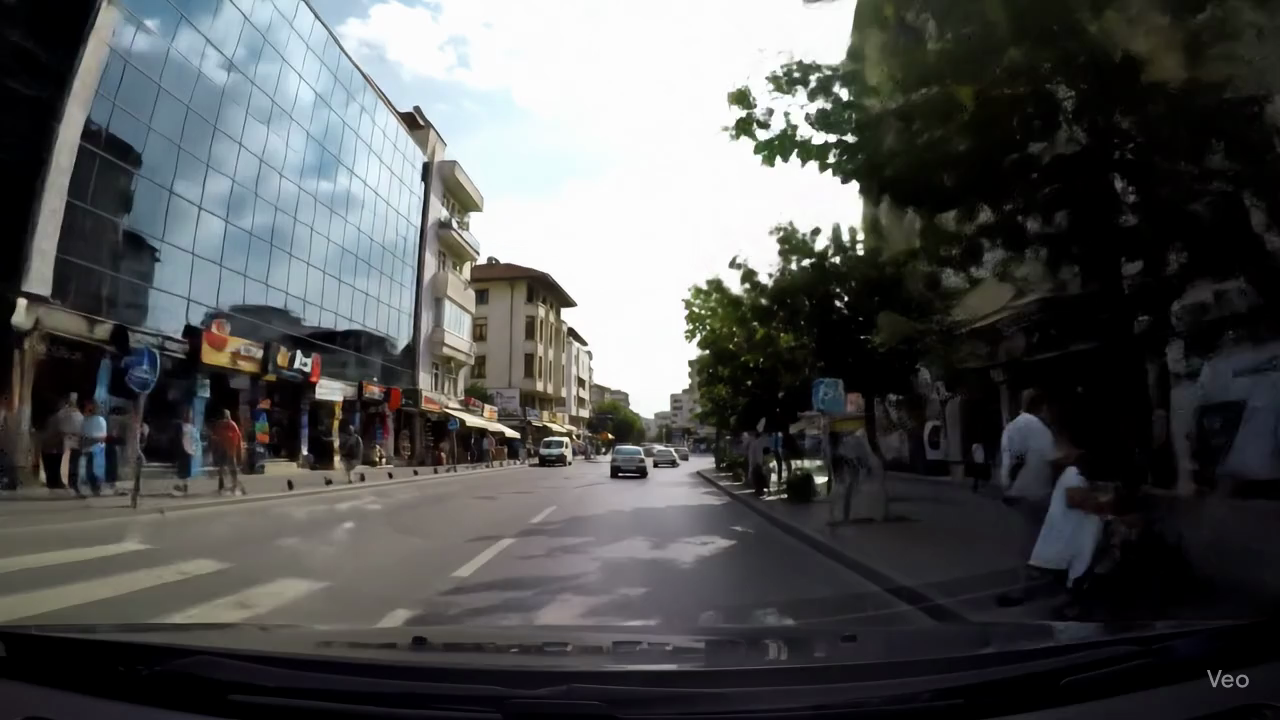
| Oslo (Norway) | Paris (France) | Rome (Italy) | Sofia (Bulgaria) |
 |
 |
 |
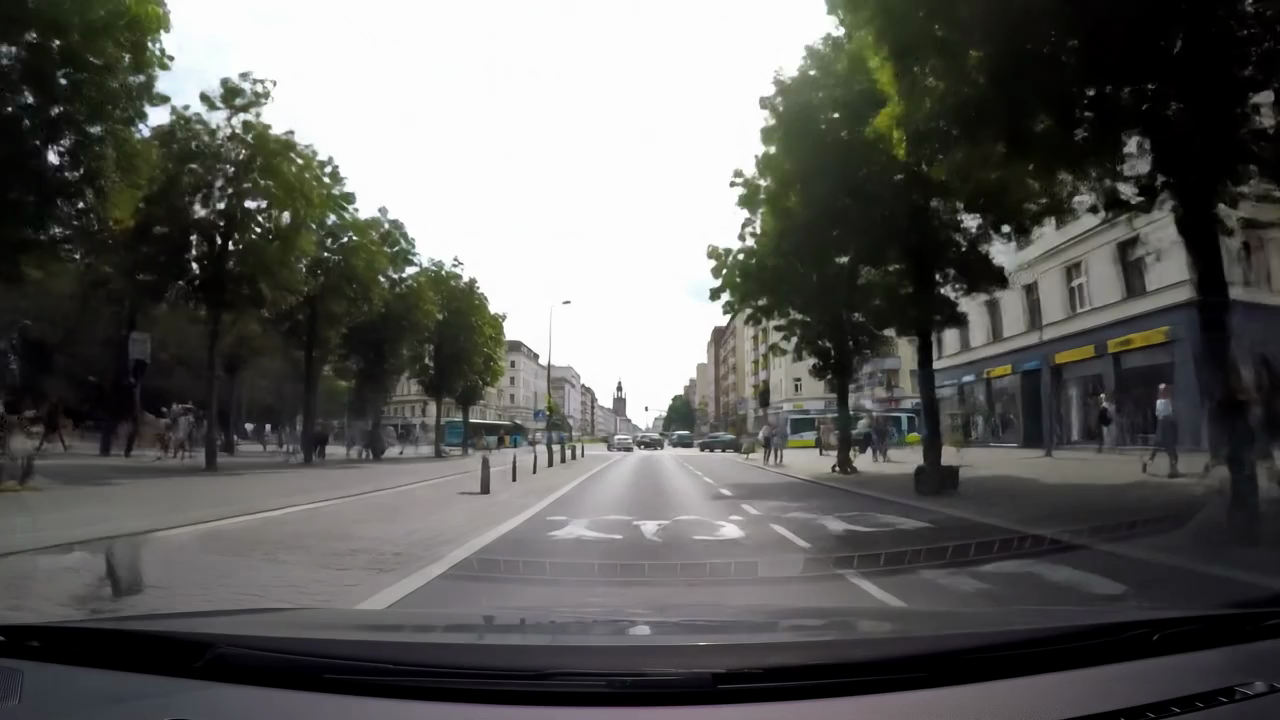 |
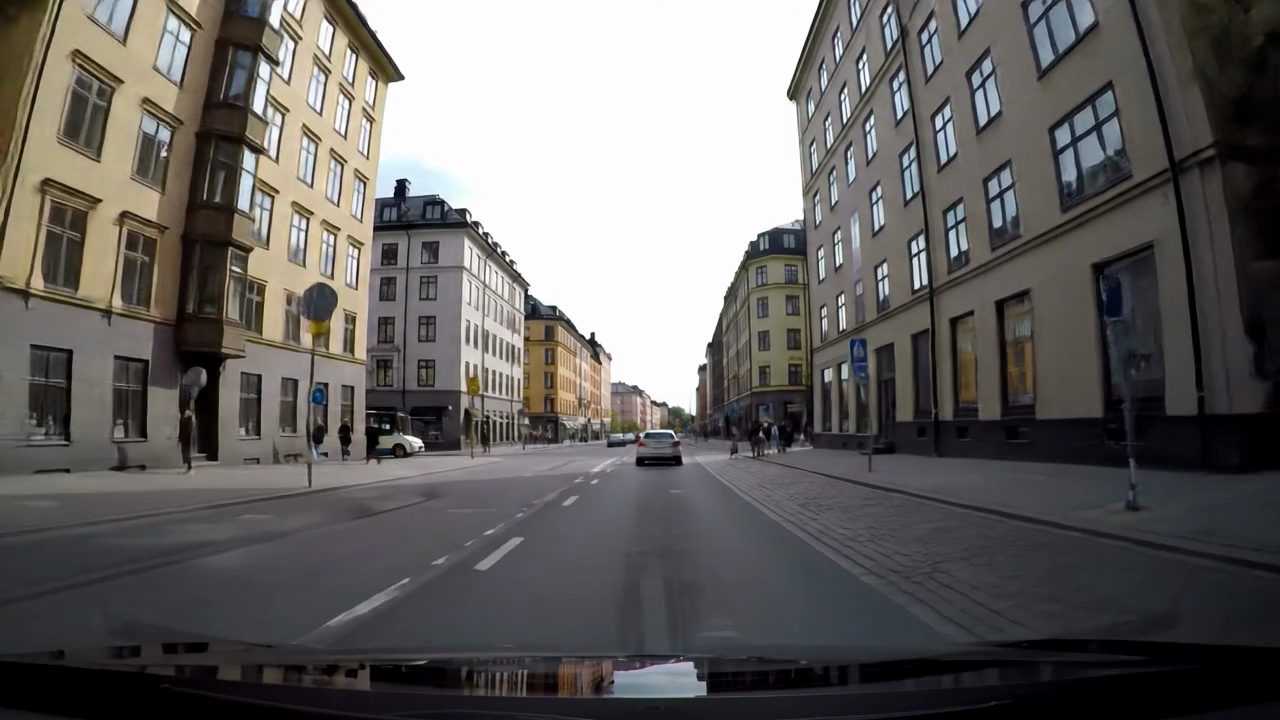
| Stockholm (Sweden) | Tirana (Albania) | Vatican City (Vatican) | Warsaw (Poland) |
 |
|||
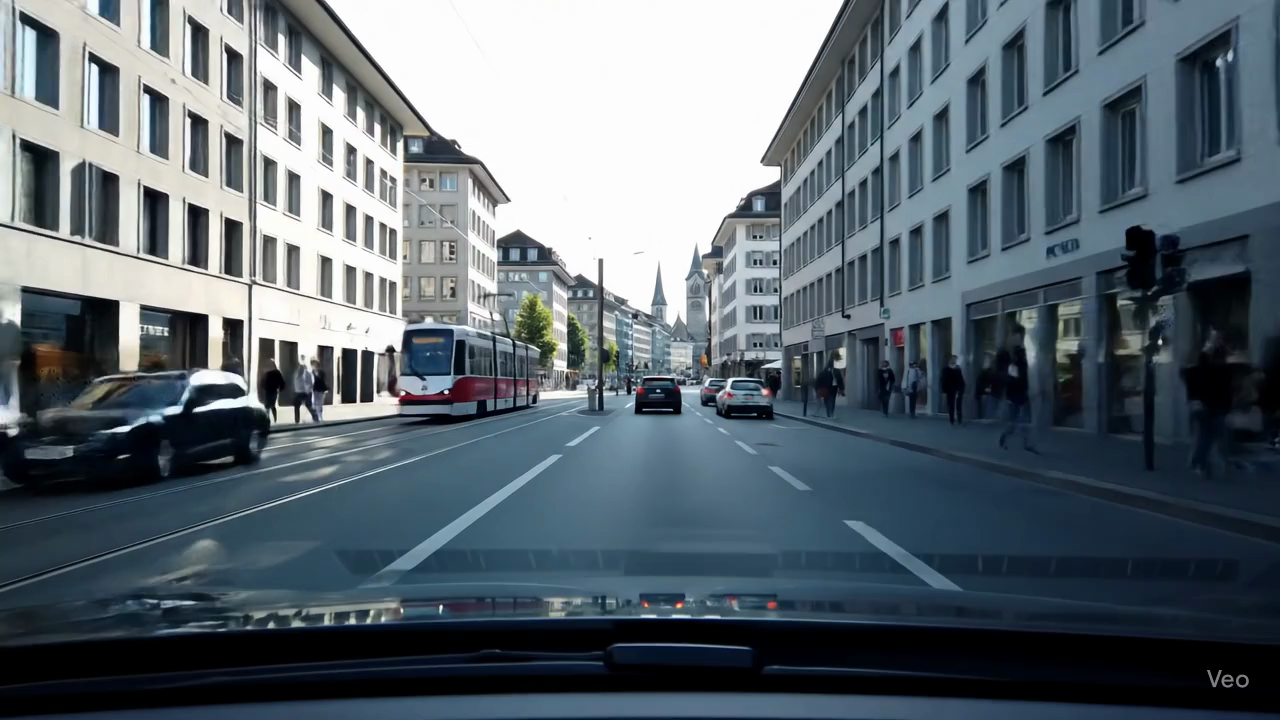
| Zurich (Switzerland) |
 |
 |
 |
 |
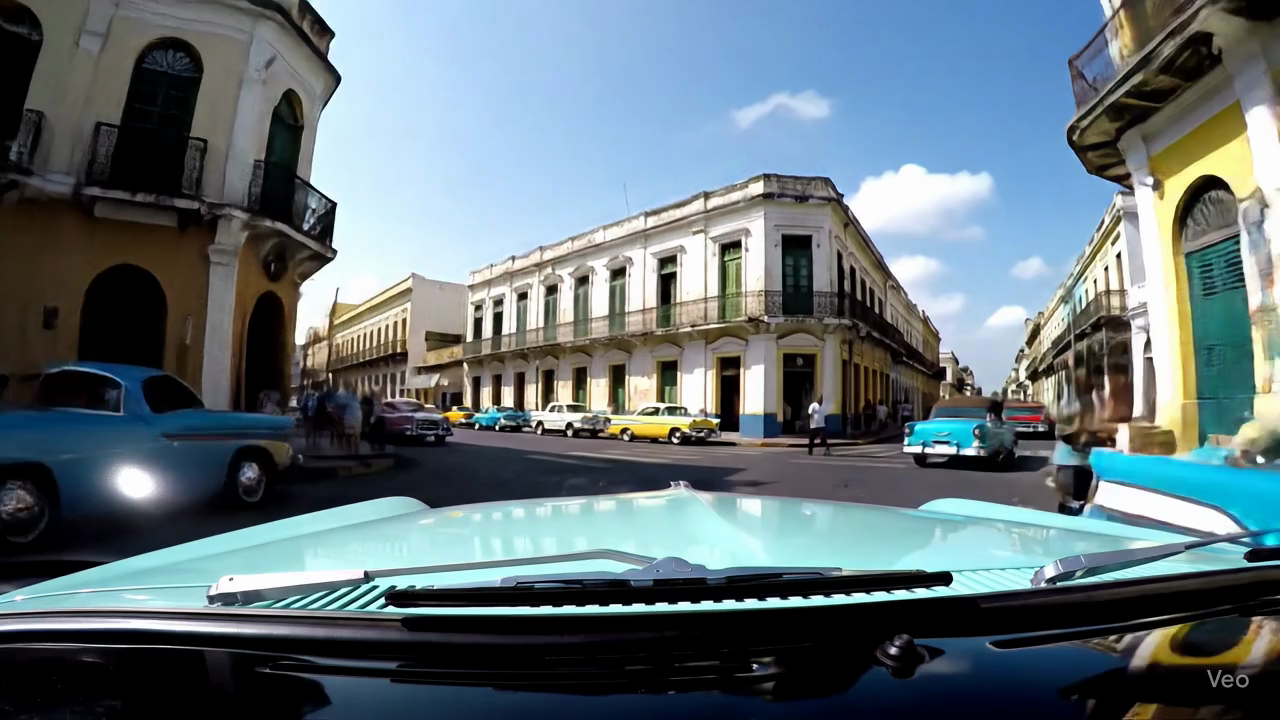
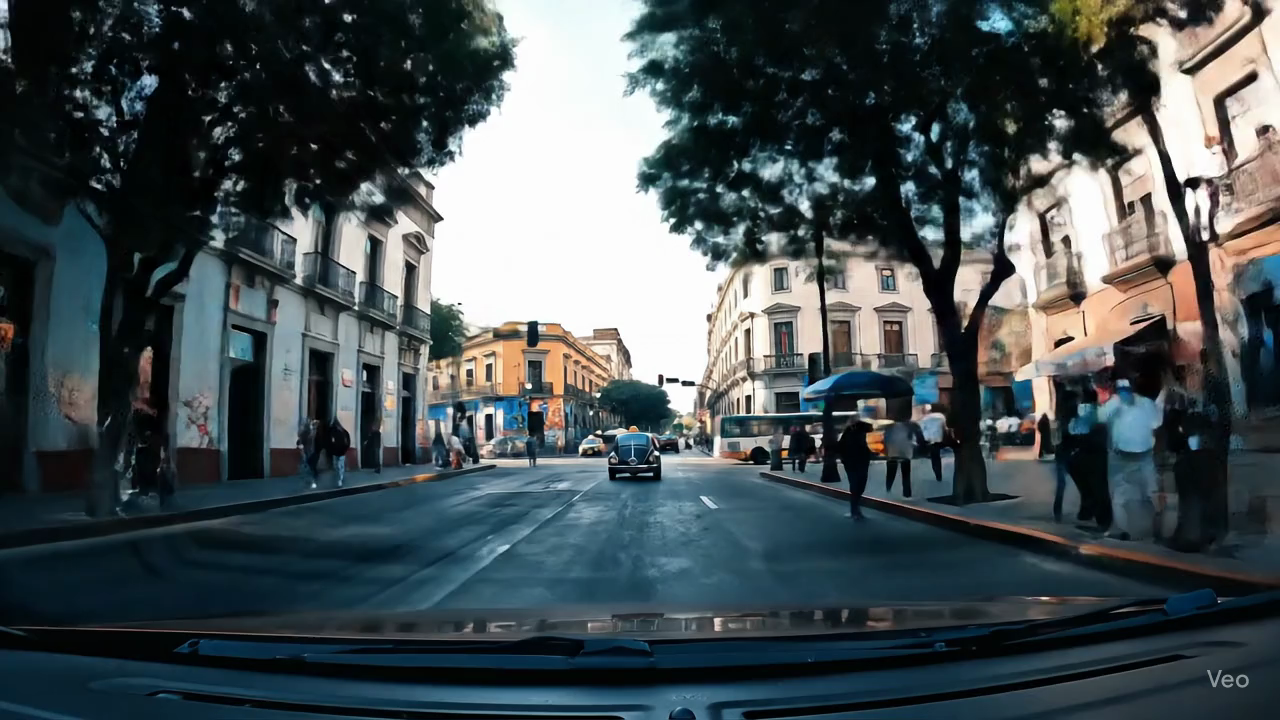
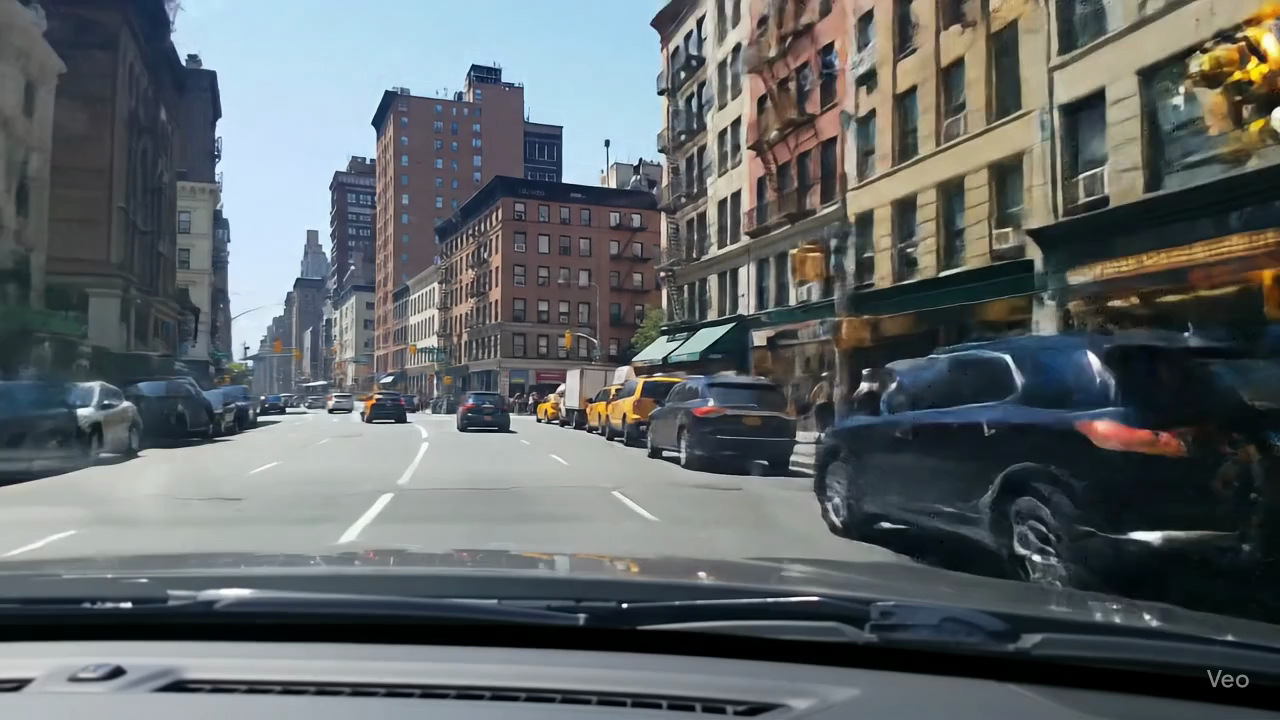
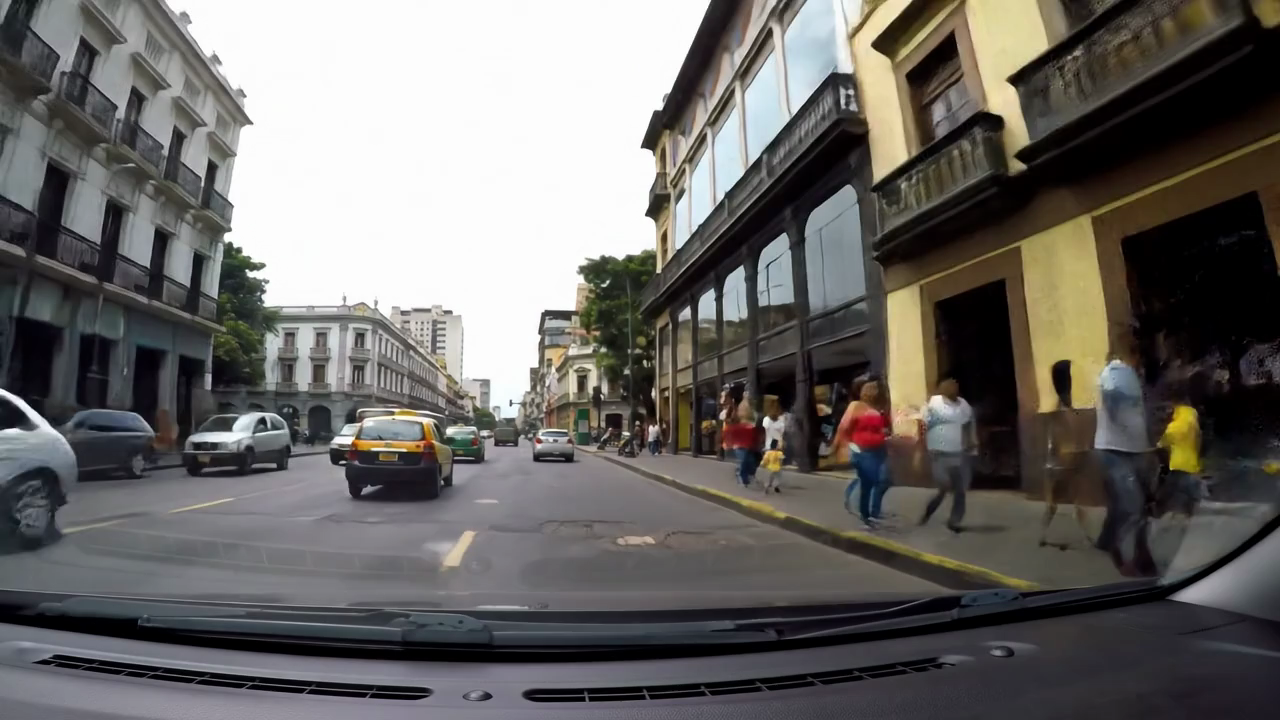
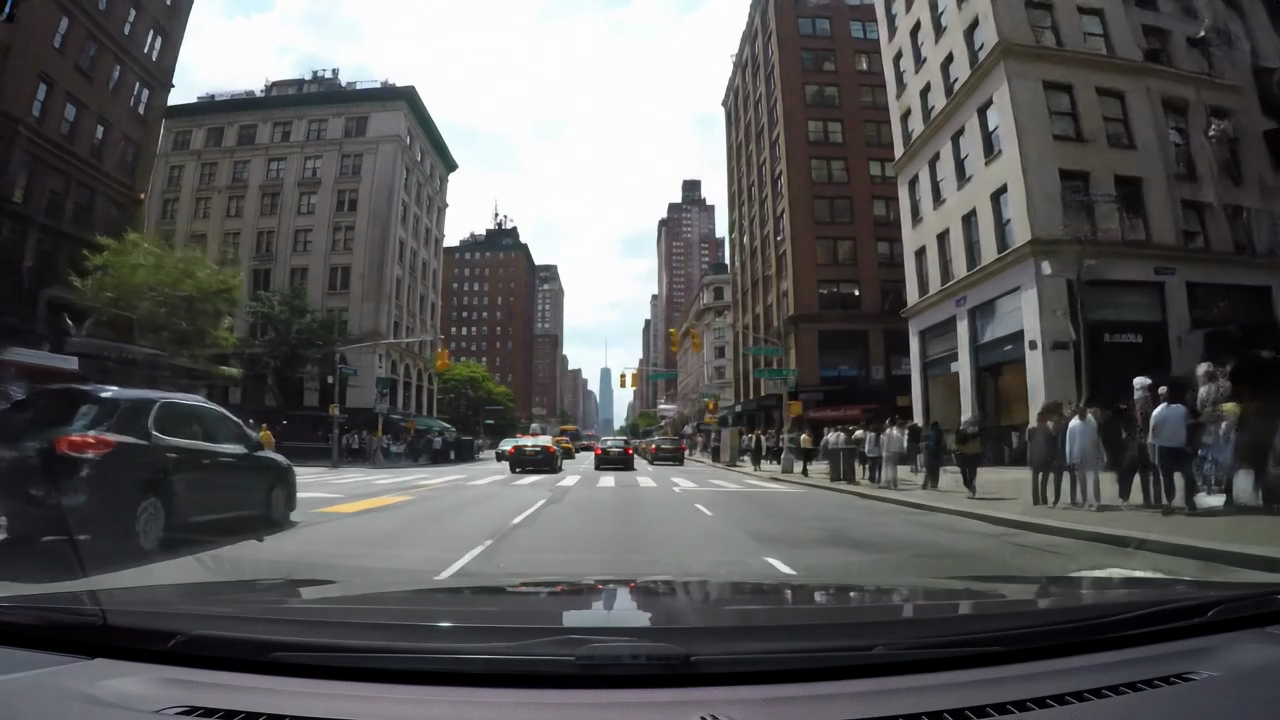
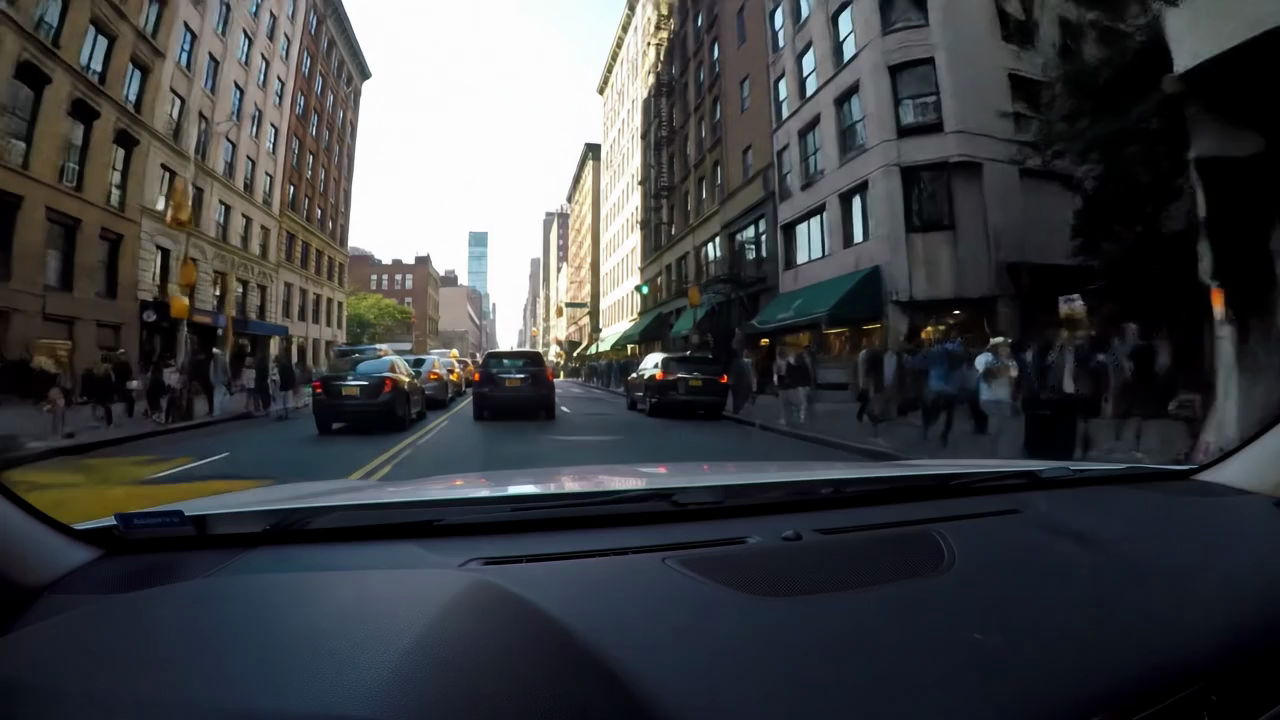
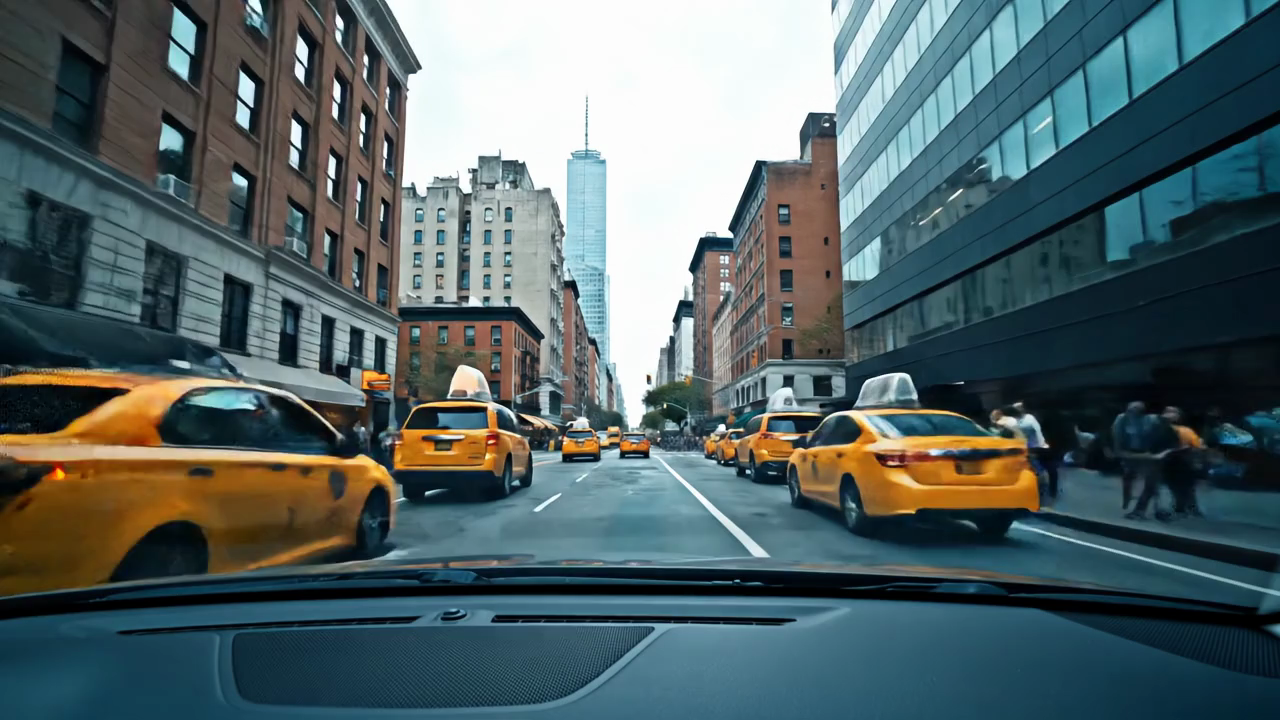
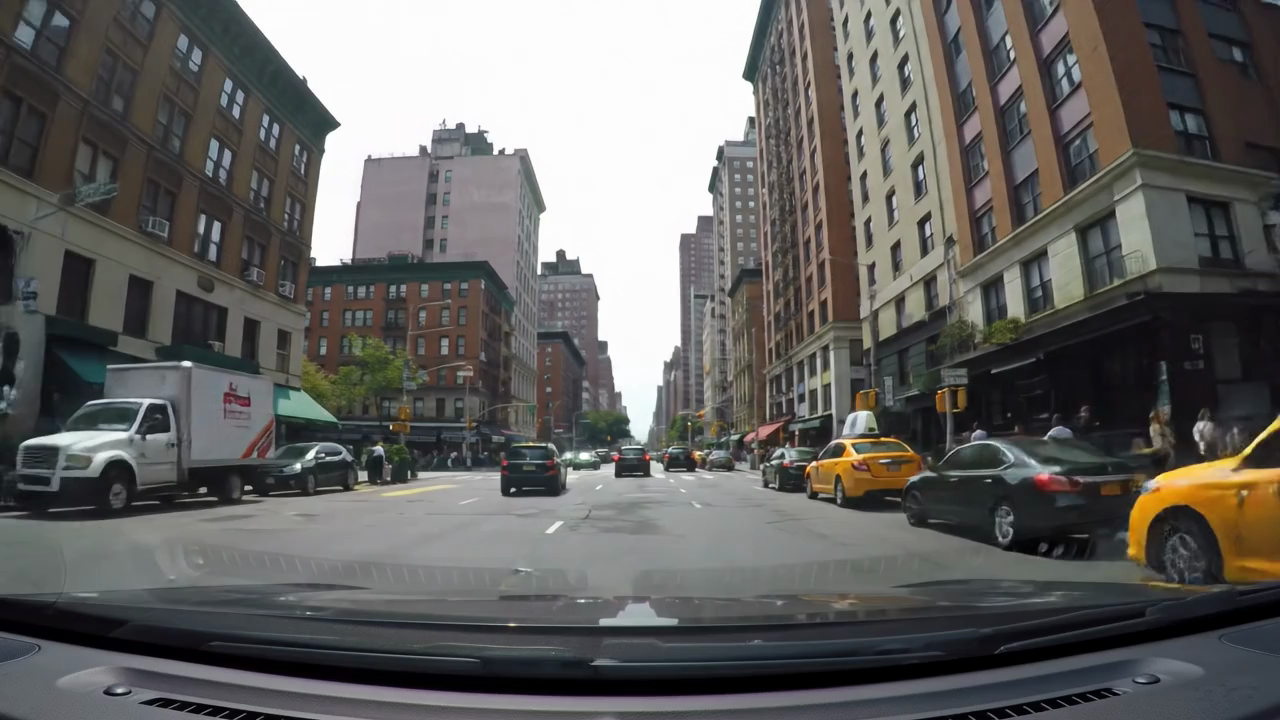
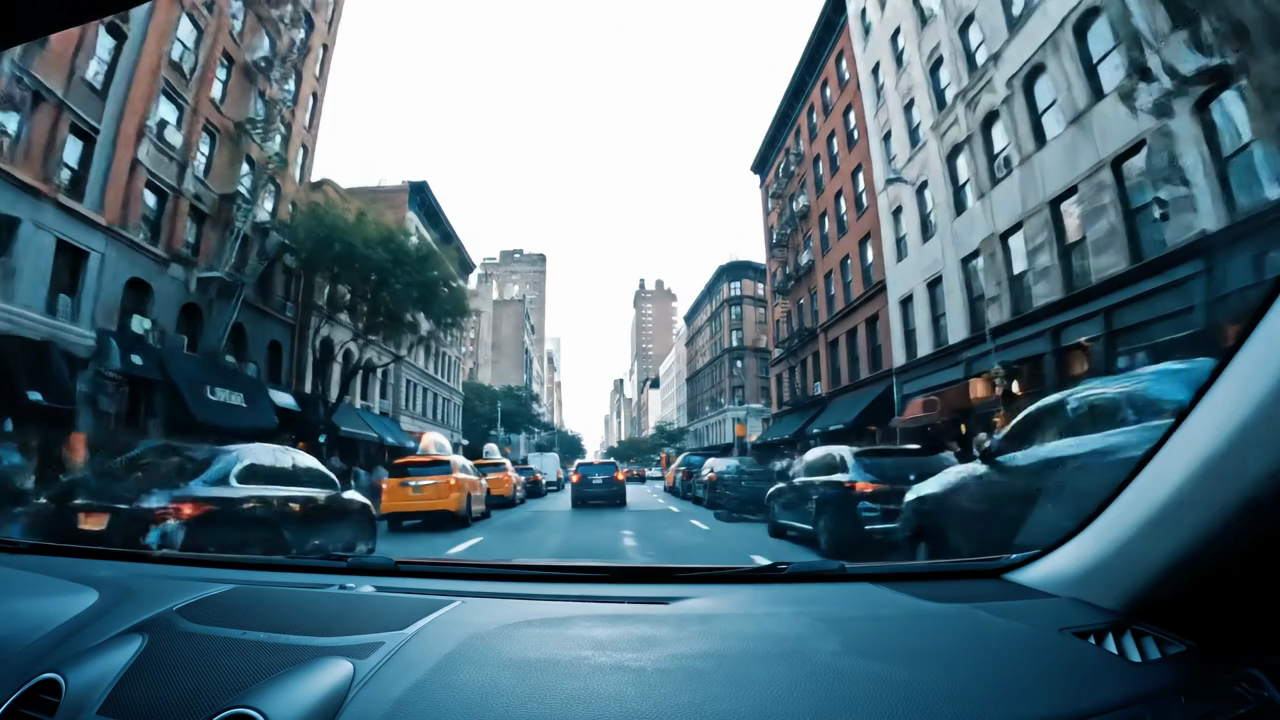
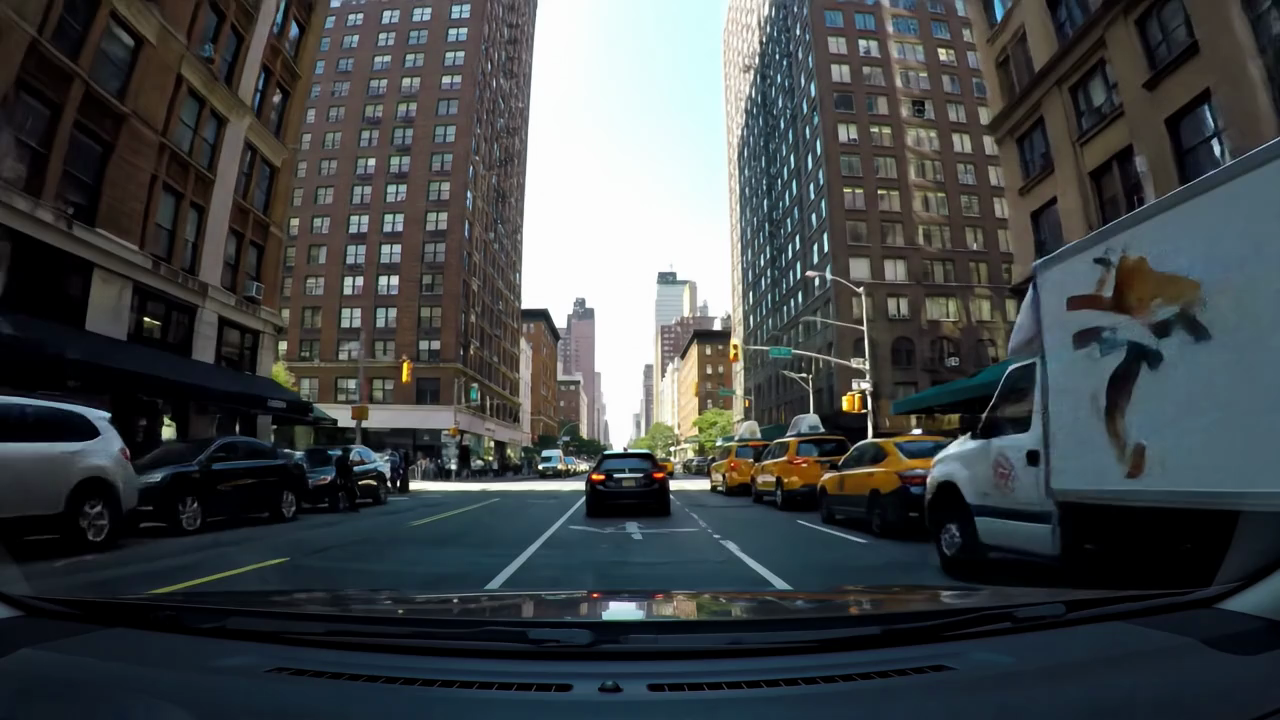
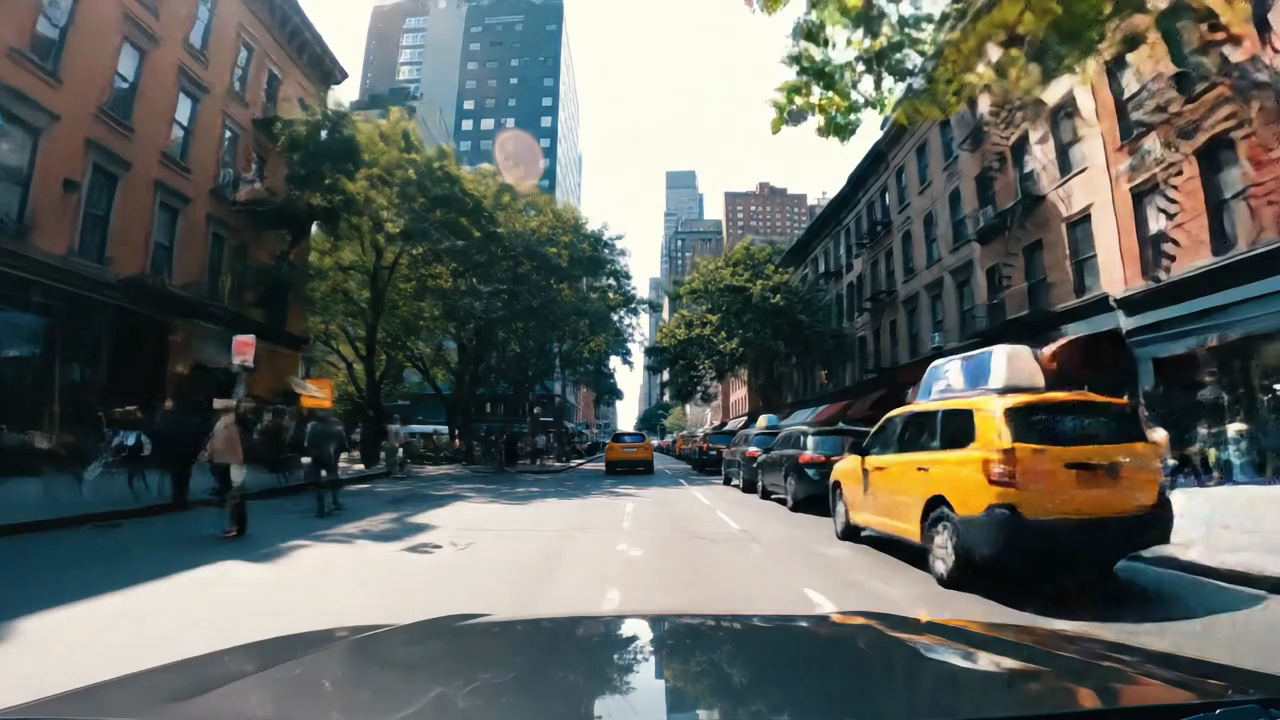
| Havana (Cuba) | Mexico City (Mexico) | New York City (United States) | Panama City (Panama) |
 |
|||
| Toronto (Canada) |
 |
 |
|
 |
| Auckland (New Zealand) | Funafuti (Tuvalu) | Jakarta (Indonesia) | Suva (Fiji) |
 |
 |
 |
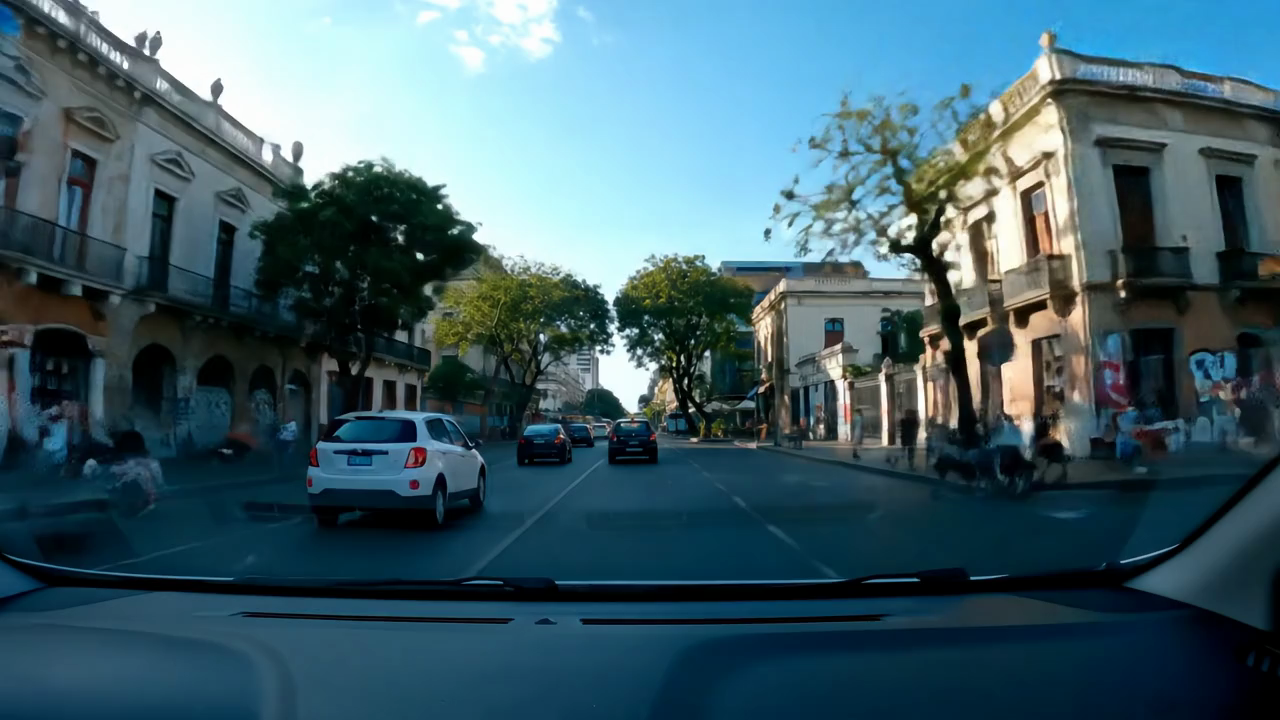 |
| Asunción (Paraguay) | Buenos Aires (Argentina) | Lima (Peru) | Montevideo (Uruguay) |
 |
 |
 |
|
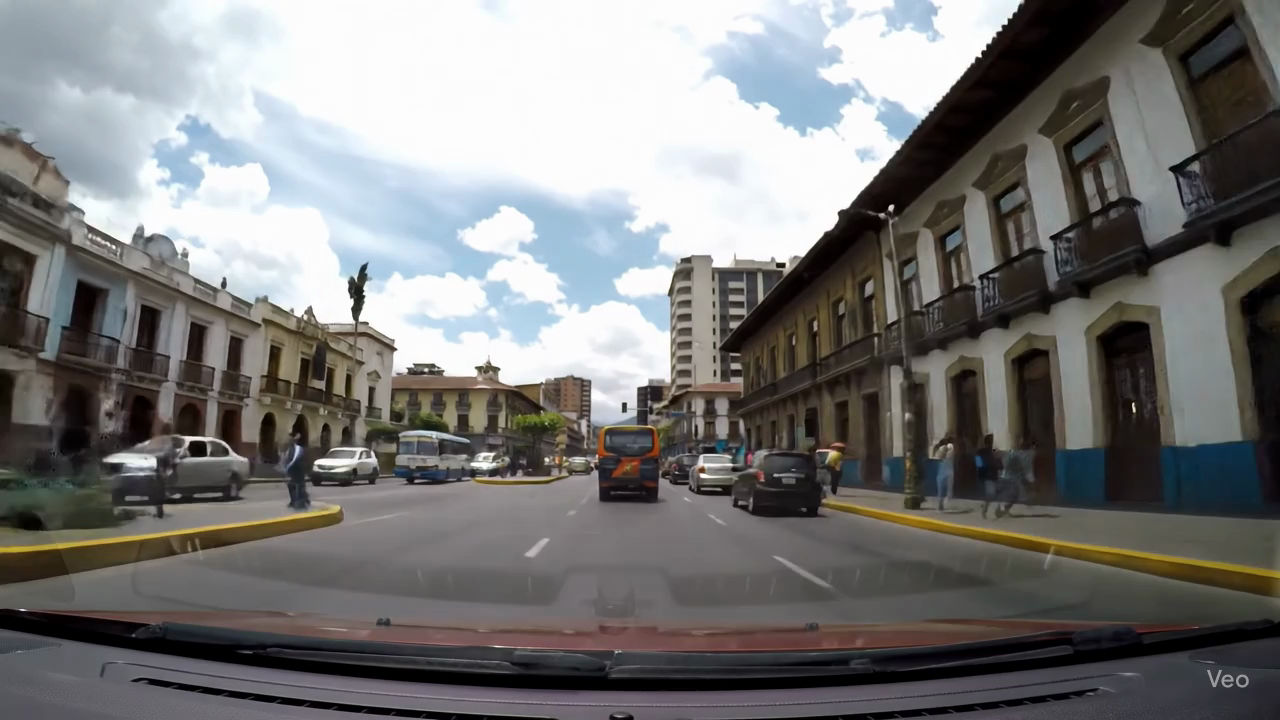
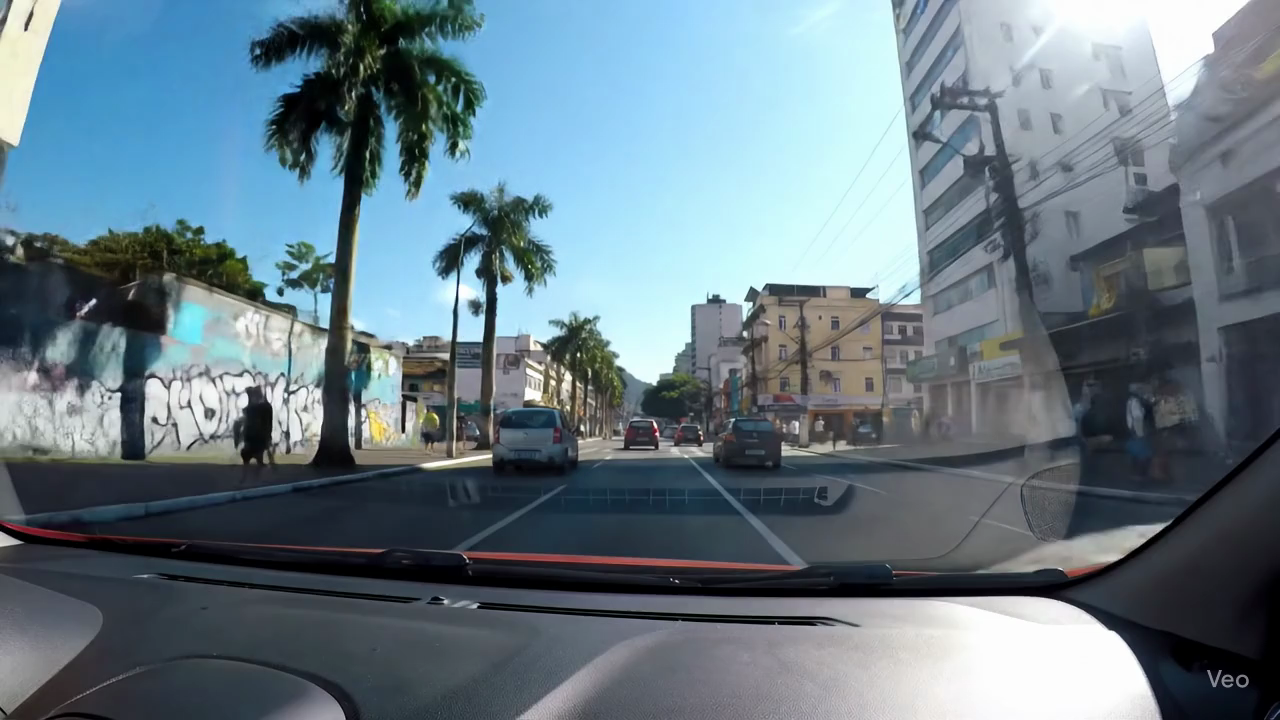
| Quito (Ecuador) | Rio de Janeiro (Brazil) | Santiago (Chile) |
 |
 |
 |
 |
 |
 |
 |
 |
 |
 |
 |
 |
 |
 |
 |
 |
 |
 |
 |
 |
If you have any questions or suggestions, feel free to reach out to md_shadab_alam@outlook.com or pavlo.bazilinskyy@gmail.com.