pi-oplsda bridges the gap between the rigorous algorithmic foundation of the gold-standard R package ropls and the modern Python data science ecosystem. It delivers blazing-fast parallel computing, native Pandas integration, and publication-ready visualizations—all in one lightweight package.
-
Standardized Rigor: Perfectly replicates
roplsstep-wise variance increments ($R^2X$ ,$R^2Y$ ,$Q^2$ ) and NIPALS-based orthogonal signal correction (OSC). -
Pandas Native: Seamlessly feed
pandas.DataFrameinto the model. Sample IDs and feature names are automatically tracked, eliminating the need for tedious matrix index management. -
Multi-Core Acceleration: Powered by
joblib, permutation tests are fully parallelized. -
Publication-Ready Graphics: Built on
matplotlibandseabornto generate clean, high-resolution diagnostic plots with smart legend placement. - Structured Export: Extract model parameters, sample scores, and biomarker statistics (VIP, Covariance, Correlation) as instantly usable DataFrames for downstream pipelines.
Note: Due to the nature of eigen-decomposition, the signs of scores and loadings may be flipped between platforms. This is mathematically equivalent and does not affect biological interpretation.
You can install pi-oplsda using either of the following methods, depending on whether you simply want to use the package or if you plan to modify the source code.
Option 1: Install directly from pypi or GitHub (Recommended for most users)
# Install module from The Python Package Index (PyPI)
pip install pi-oplsda

# Or you can choose install module from GitHub
pip install git+https://github.com/KaikunXu/pi-oplsda.git
Option 2: Install from source (For developers)
If you want to contribute to the project, modify the algorithm, or explore the source code, you can clone the repository and install it in "editable" mode. This means any changes you make to the local code will immediately take effect without needing to reinstall the package.
# 1. Clone the repository
git clone https://github.com/KaikunXu/pi-oplsda.git

# 2. Navigate into the project directory
cd pi-oplsda

# 3. Install in editable mode
pip install -e .We provide interactive Jupyter Notebooks that walk you through the entire OPLS-DA workflow and our rigorous validation process:
- Quickstart Tutorial: A comprehensive guide from data loading to visualization and prediction.
- R-ropls Equivalence Benchmark: The complete script used to prove numerical consistency between Python and R implementations.
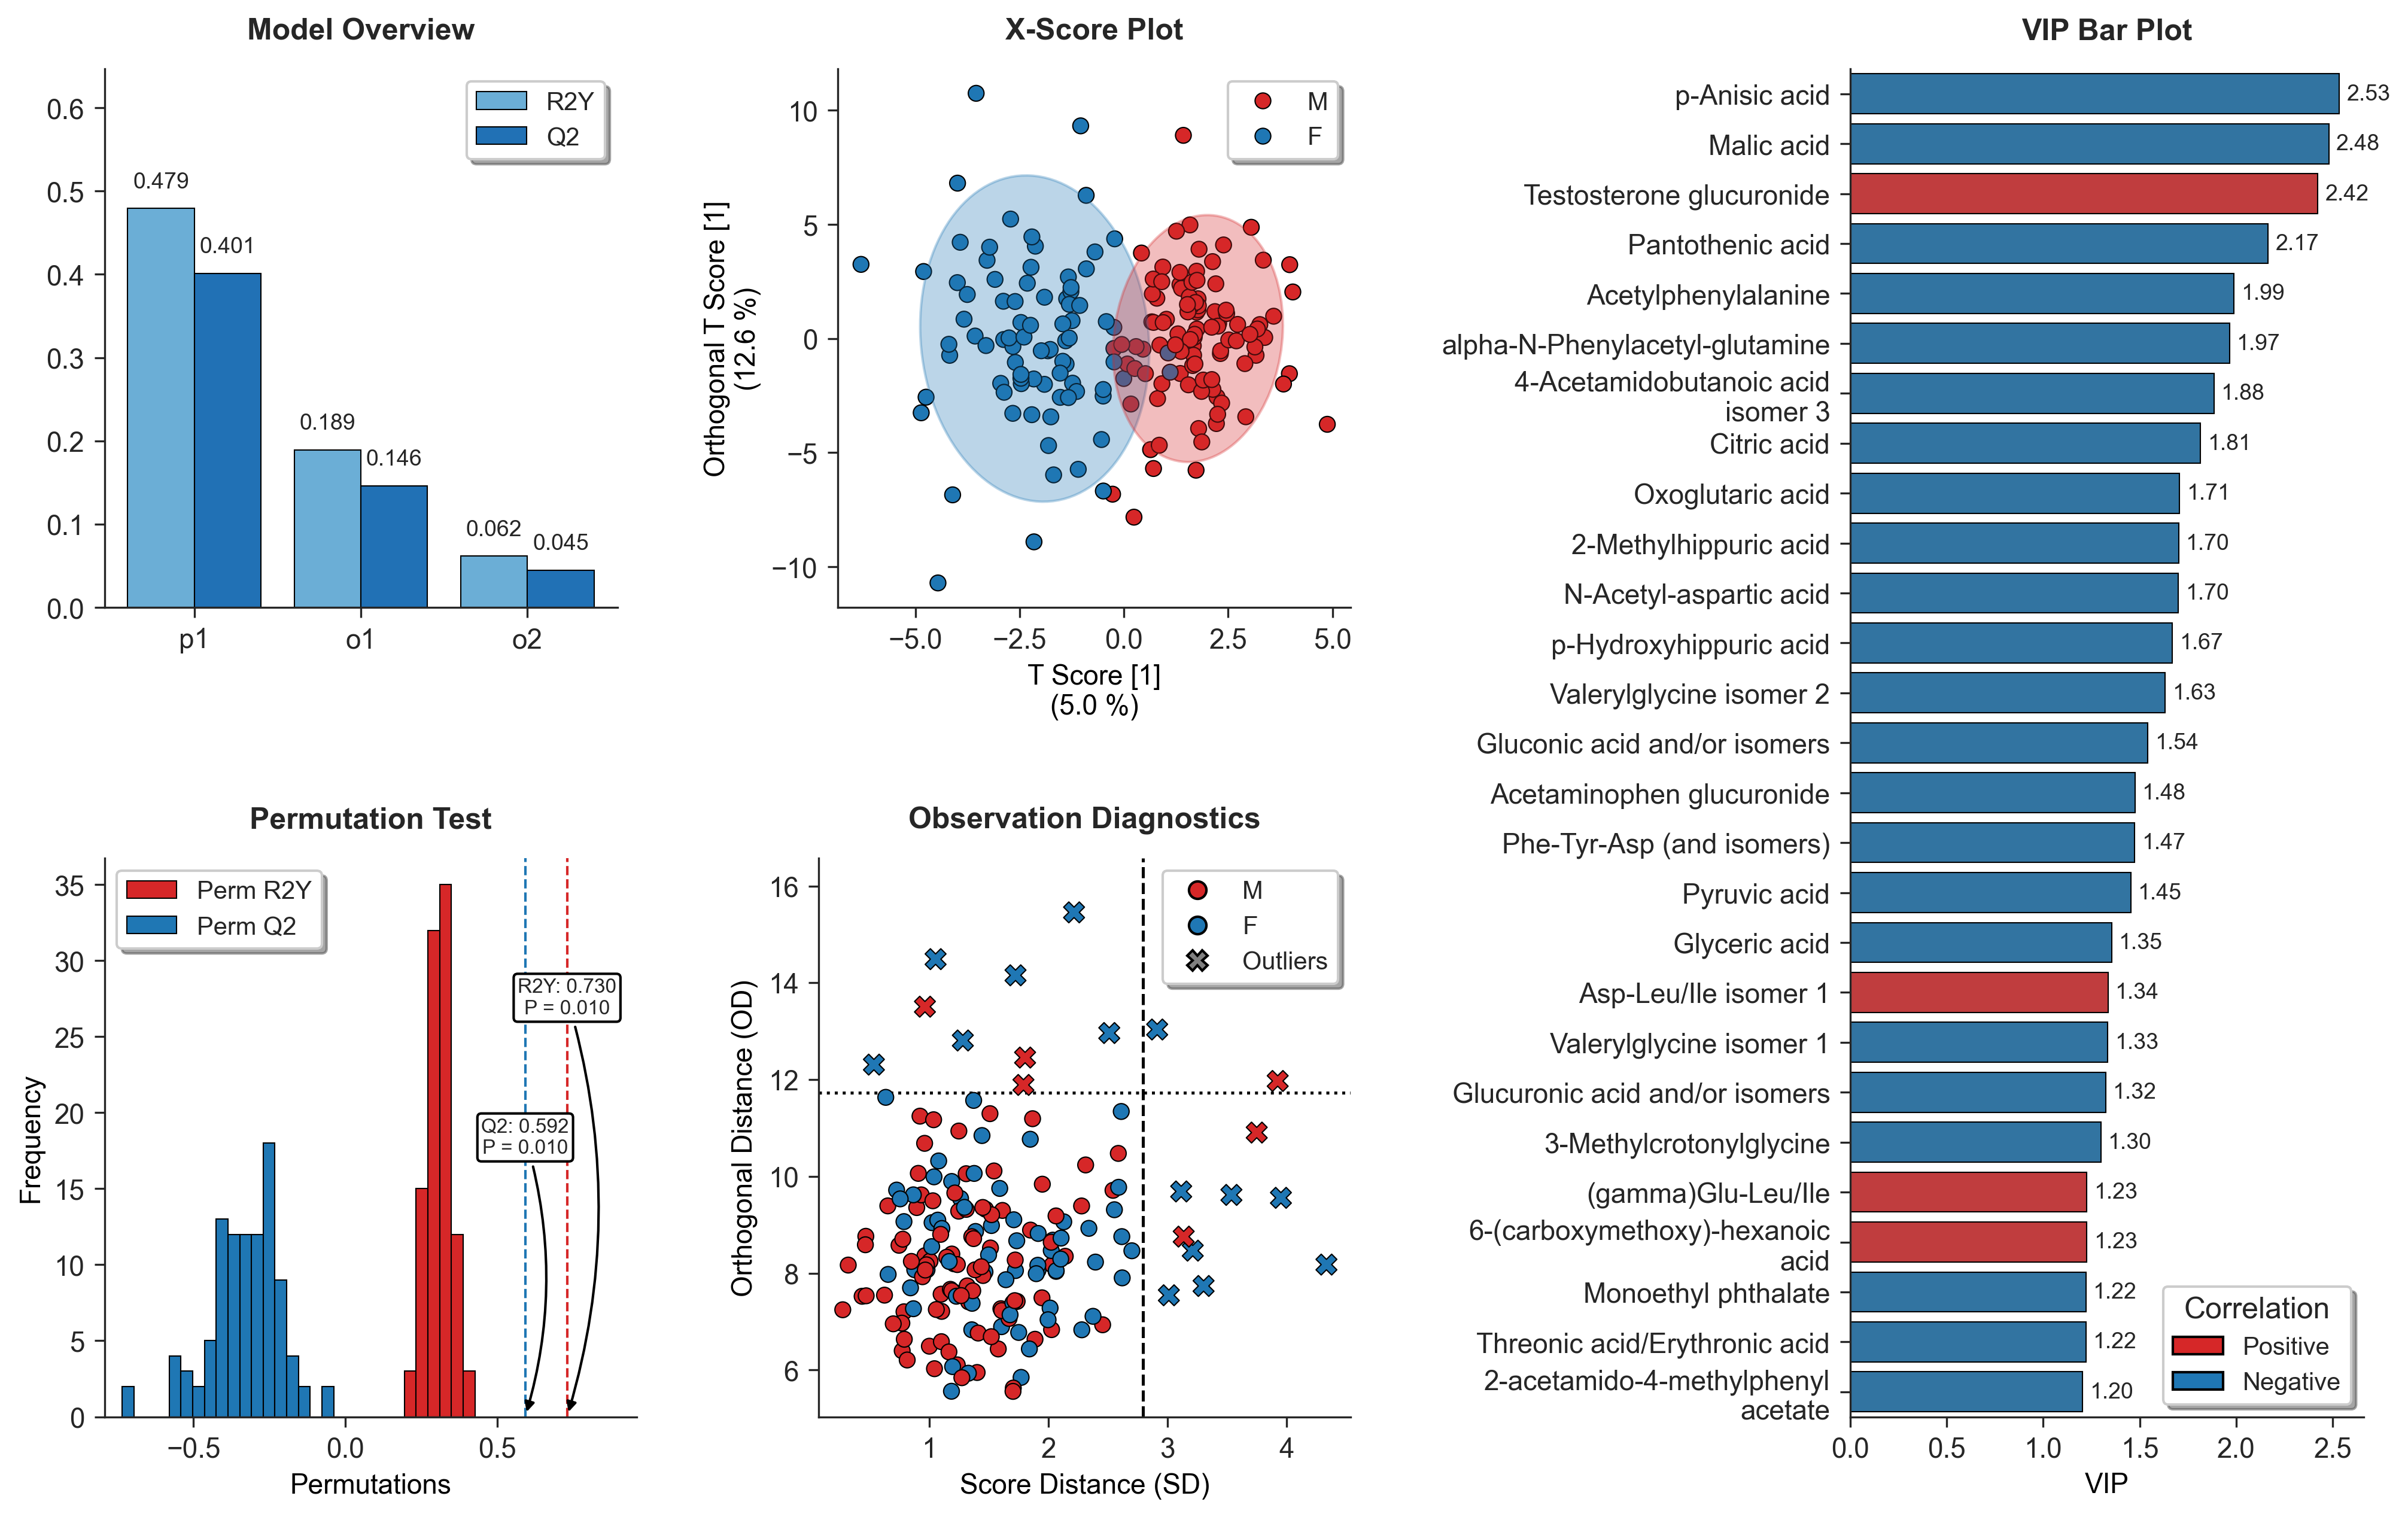
Running the OPLSDA_Visualizer will automatically generate a suite of tightly integrated diagnostic subplots to evaluate your model from multiple dimensions:
-
Model Overview: Displays the step-wise increments of
$R^2Y$ and$Q^2$ for both predictive and orthogonal components, illustrating the model's global explanatory and predictive capacity. -
X-Score Plot: Visualizes sample clustering and separation in the predictive latent space, complete with 95% Hotelling's
$T^2$ confidence ellipses. - Observation Diagnostics: Evaluates the relationship between sample influence (Score Distance) and model fit (Orthogonal Distance / DModX) to robustly identify multivariate outliers.
-
Permutation Test: Validates model robustness against overfitting by comparing the original
$R^2Y$ and$Q^2$ against permuted null distributions, providing empirical p-values. - VIP Bar Plot: Ranks the top features contributing to group separation. It features automatic text wrapping for excessively long metabolite names on the Y-axis to ensure clean, publication-ready layouts.
- S-Plot (Optional): Highlights potential biomarkers based on the interplay between covariance (magnitude) and correlation (reliability). (Note: This plot is available exclusively for binary classification models, as demonstrated in the Quickstart Tutorial).
pi-oplsda is strictly validated against the gold-standard R package ropls (Bioconductor) to ensure scientific integrity. Our cross-platform benchmarking demonstrates that pi-oplsda produces numerically identical results across all key OPLS-DA metrics.
Using the Sacurine human urine dataset (183 samples, 109 metabolites), we compared the Python and R implementations:
| Metric | Description | Comparison |
|---|---|---|
| Global Quality | Cumulative |
Approximately equal |
| Error Assessment | Root Mean Square Error of Estimation (RMSEE) | Approximately equal |
| Latent Space | Predictive Scores ( |
Pearson's r > 0.999 |
| Variable Importance | Variable Importance in Projection (VIP) scores | Pearson's r > 0.999 |
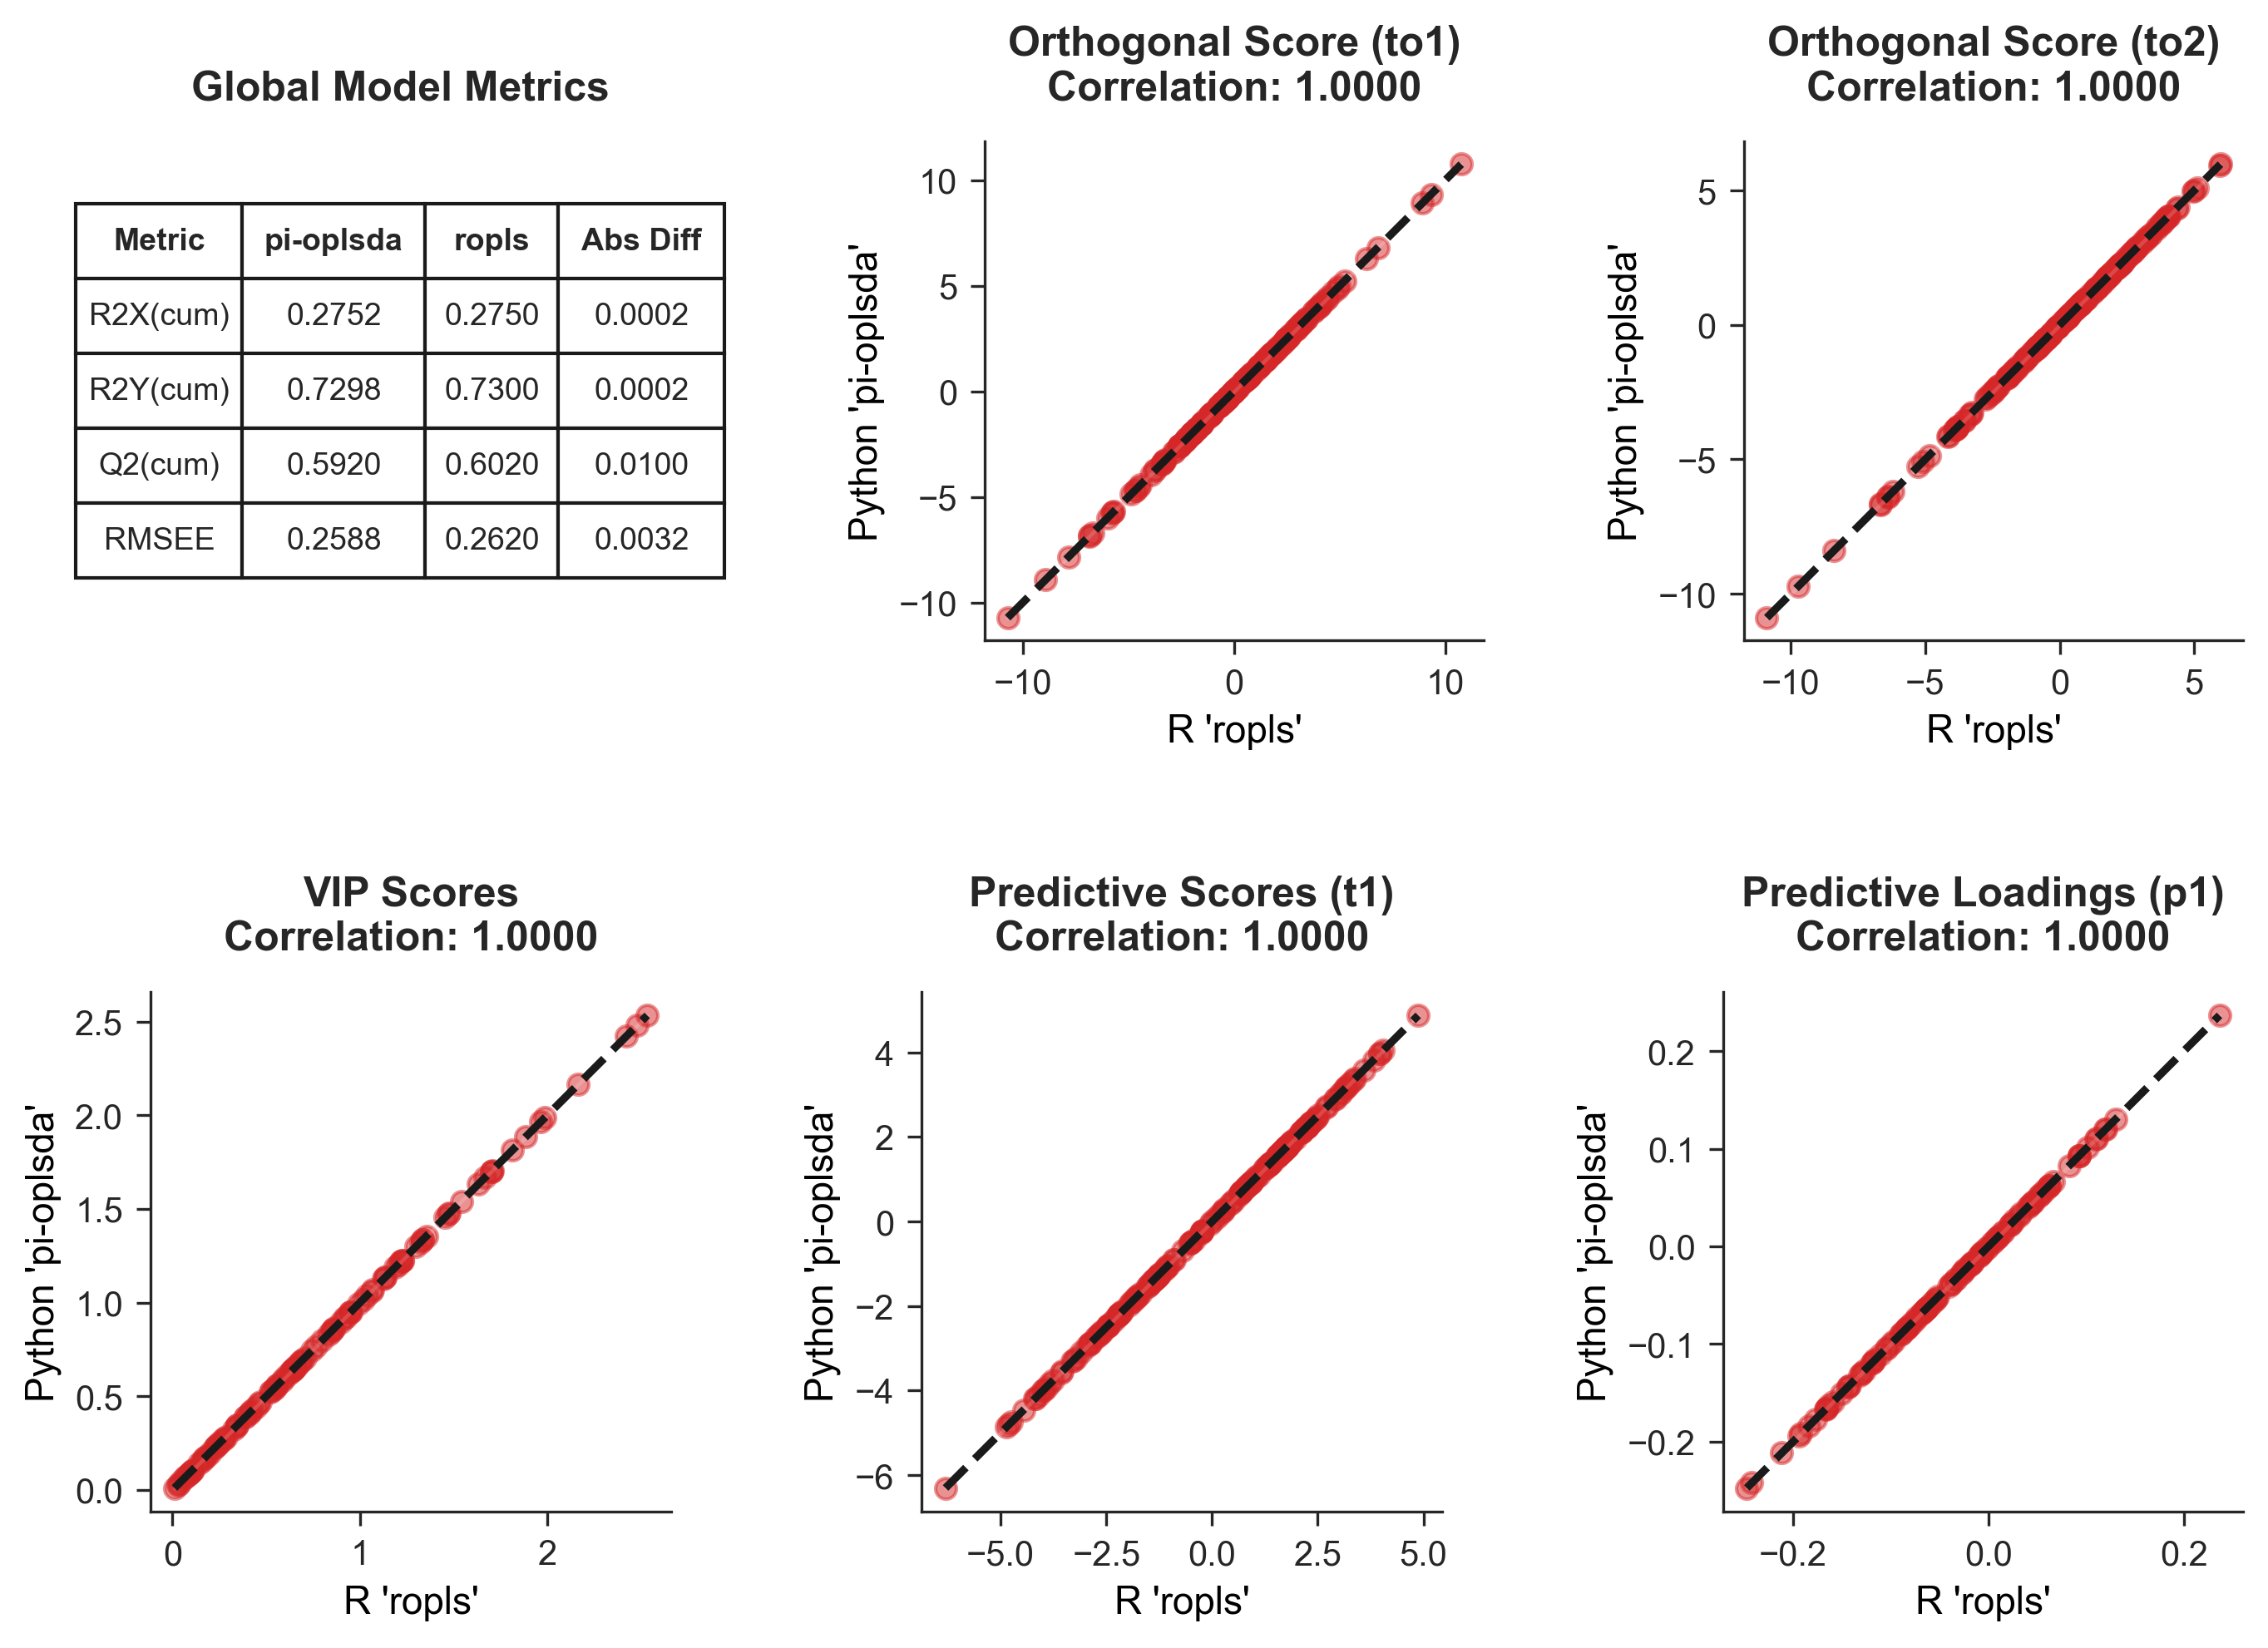
Cross-platform benchmarking demonstrates that pi-oplsda produces numerically identical results across all key OPLS-DA metrics. To ensure a rigorous, one-to-one comparison of the underlying computational results, the testing process directly invokes the R engine via the rpy2 interface. Model parameters were strictly aligned between platforms, fixing the predictive component to 1, optimizing orthogonal components (n=3), and employing 7-fold cross-validation.
In the visualizations below, the solid red scatter points map the values generated by both platforms as coordinate pairs (
-
Global Model Metrics (Top-Left): Compares the overall cumulative explained variance (
$R^2X$ ,$R^2Y$ ), cross-validated predictability ($Q^2$ ), and Root Mean Square Error of Estimation (RMSEE). The negligible absolute differences (Abs Diff$< 10^{-2}$ ) confirm macroscopic equivalence. -
Orthogonal Latent Space (Top-Right): Displays the correlation of the orthogonal score vectors (e.g.,
$t_{o1}, t_{o2}$ ). This confirms that both models possess identical geometric capabilities in extracting and filtering intra-class structured noise. -
Feature Importance & Predictive Space (Bottom Row): Illustrates the three critical vectors driving the discriminatory power of OPLS-DA: VIP Scores (determining biomarker ranking), Predictive Scores
$t_1$ (driving sample clustering), and Predictive Loadings$p_1$ (determining feature weights). The diagonal alignment confirms absolute accuracy in microscopic sample profiling and feature extraction.
The algorithmic foundation of pi-oplsda is deeply inspired by the excellent R package ropls.
Note: Portions of this codebase, including code refactoring and documentation, were refined with the assistance of Gemini 3.1 Pro. All AI-assisted contributions have been strictly reviewed by the human author to ensure scientific accuracy and code quality.
Contributions, issues, and feature requests are welcome! Feel free to check the issues page.
This project is licensed under the MIT License.